One CLI for Your Entire
Observability Stack
For you and your agents. Validate configs, find instrumentation gaps, and query live telemetry, all from the terminal.


Investigate From the Terminal
Your agents and your team get fast, structured access to service maps, logs, and queries, without leaving the terminal.
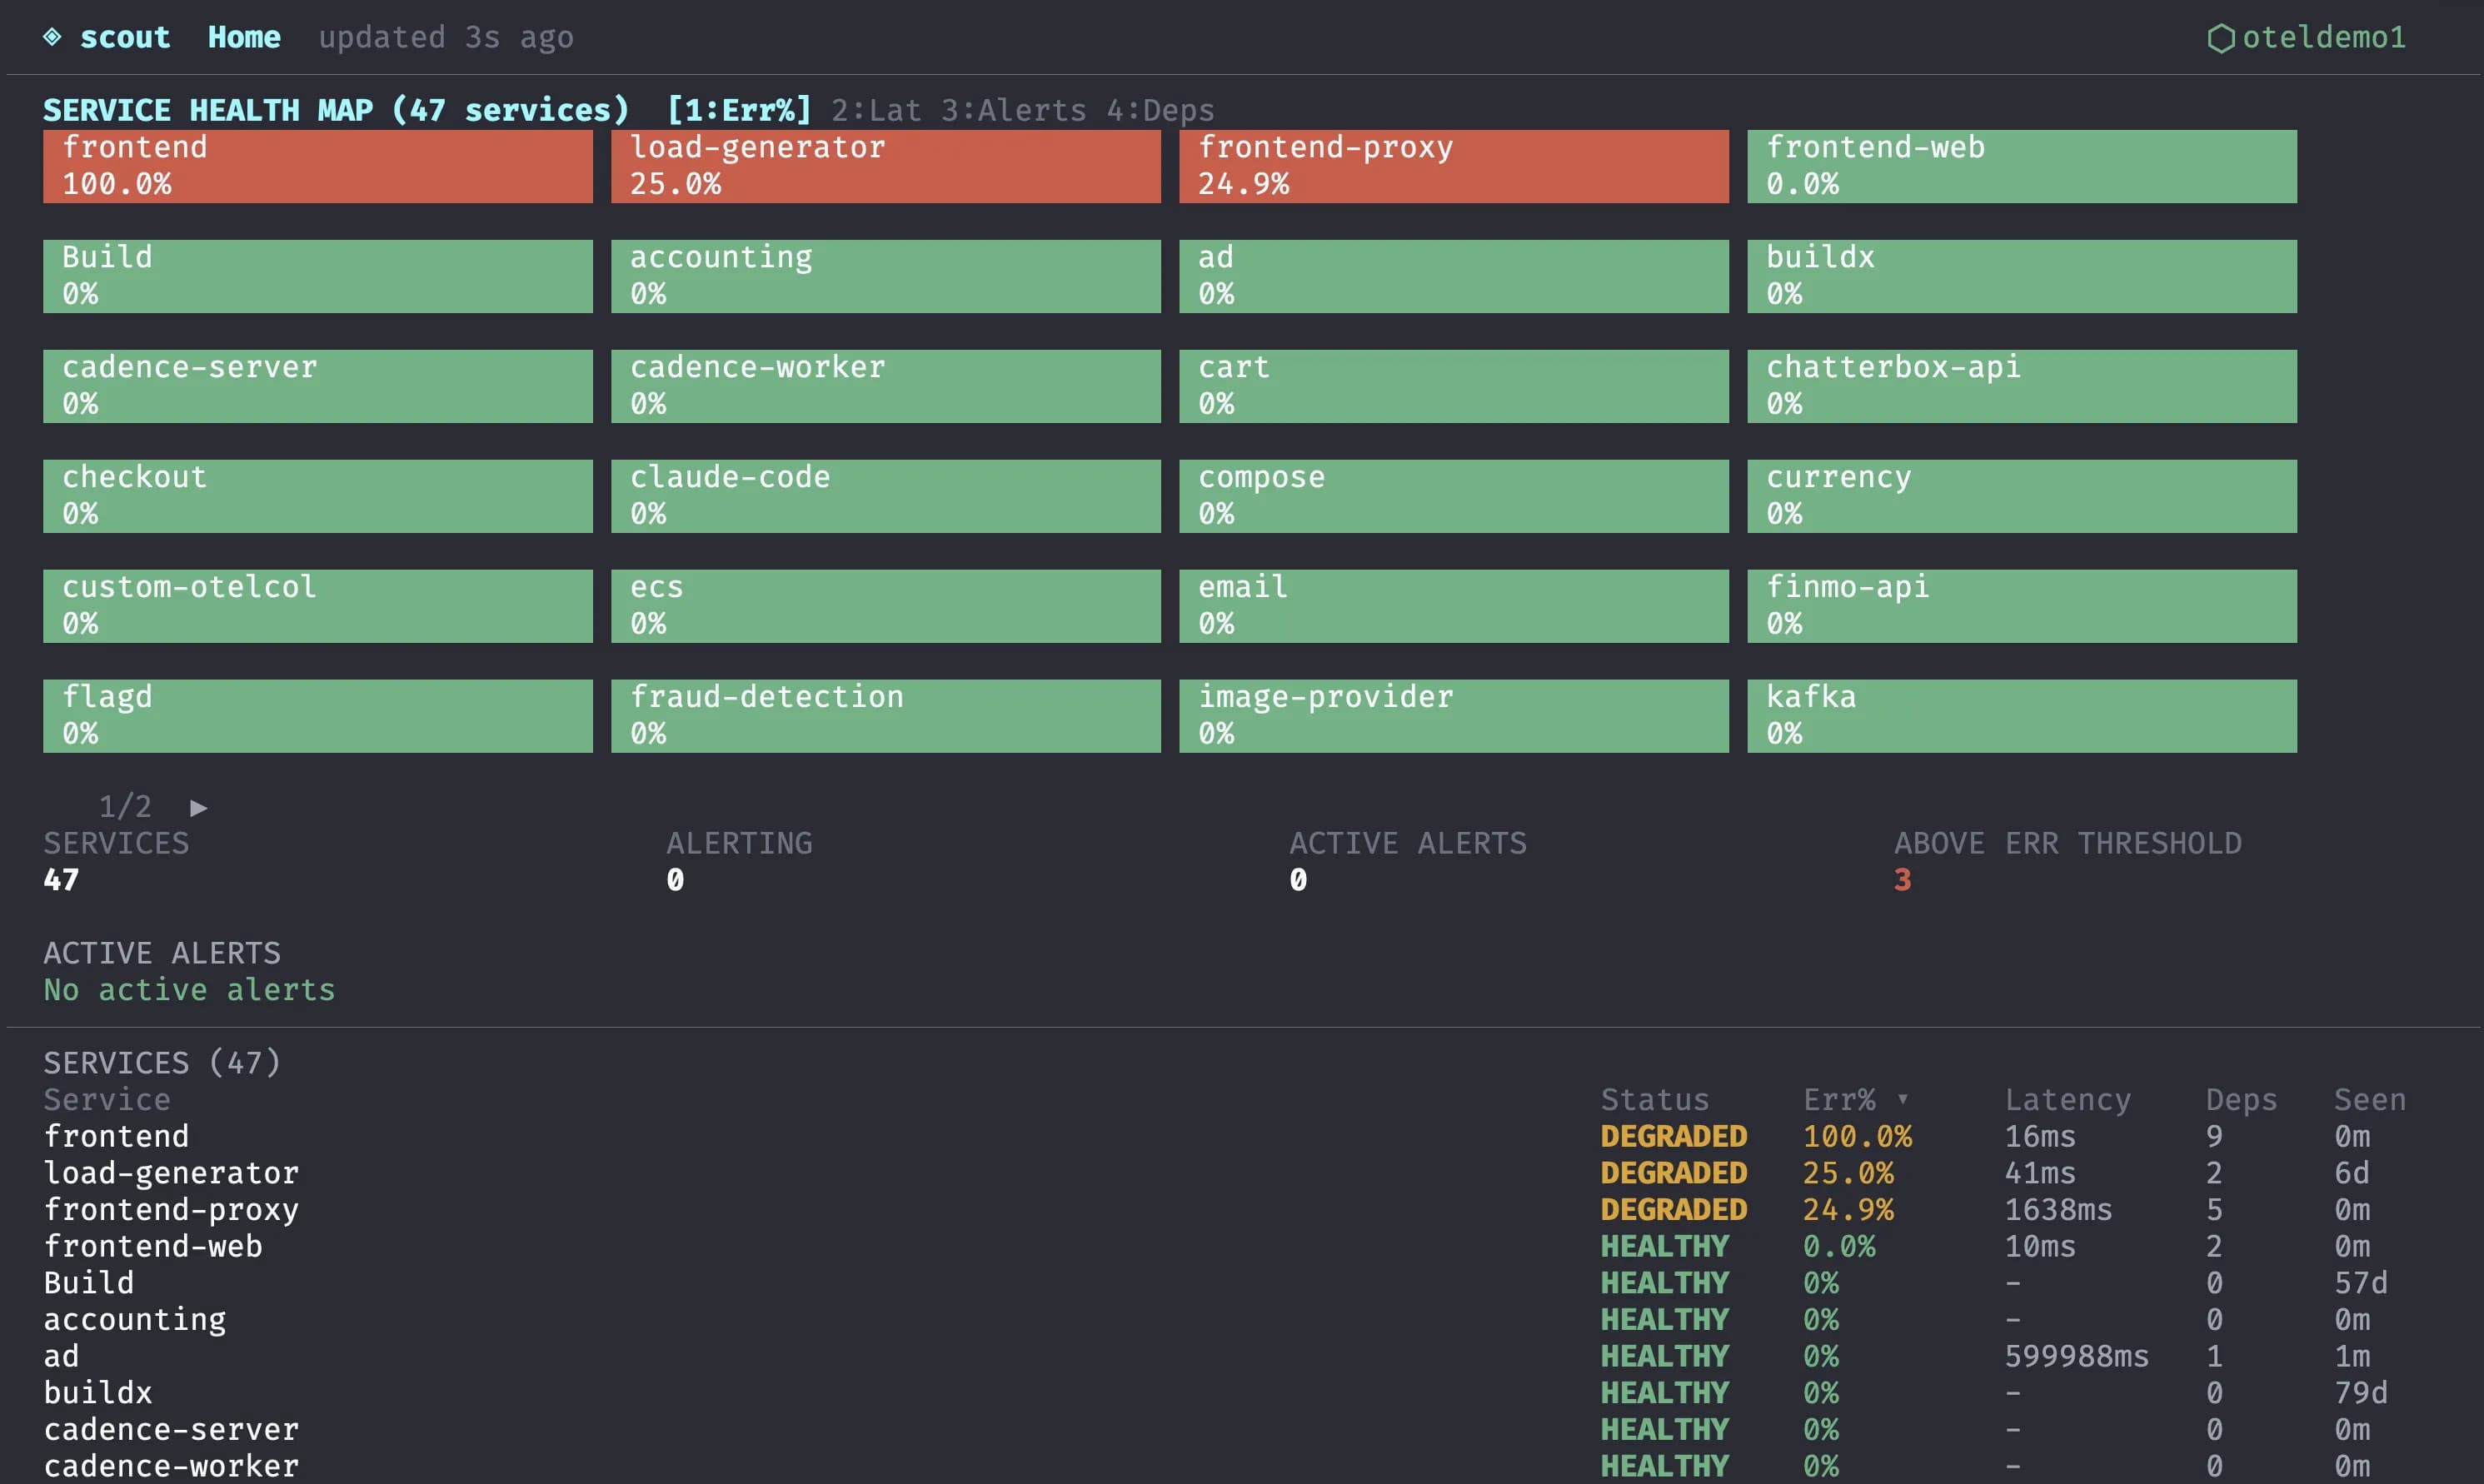
Service Map
Full topologySee every service in your system, who calls whom, and what span names cross those edges.
- Service topology mapping
- Dependency tracking
- Span name discovery
Search Logs
Agent-readyFind relevant logs by timespan and service. Fast, structured results your agents can act on.
- Time-range filtering
- Service scoping
- Structured output
Get Query
No syntax neededGenerate fast queries for alerts and dashboards without learning the query syntax.
- Alert query generation
- Dashboard query generation
- Syntax-free
Health Summary
Coming SoonFind out what you should be worried about right now. Alerts, anomalies, and degraded services.
- Active alert summary
- Anomaly detection
- Service health status
From Zero to Collecting Data
Validate your configs, find instrumentation gaps, and generate working collector setups, without reading the OTel docs.
Validate Config
No auth requiredDrop in your OTel collector config and immediately know if it's broken, misconfigured, or violating semantic conventions. No auth needed.
- Config syntax validation
- Semantic convention checks
- Exporter auth verification
Scan Codebase
Read-onlyPoint at any folder and get a report: which services are instrumented, which aren't, and what's partially done. Read-only, no code changes.
- Service detection
- Instrumentation coverage
- Gap identification
Instrument Brief
Coming SoonGet a structured brief describing exactly what instrumentation is missing and how to add it. Paste it into your coding agent and let it do the work.
- Language-aware analysis
- Framework detection
- Agent-ready output
Scan Infrastructure
Coming SoonDetect your k8s environment and generate a working OTel collector config with Scout pre-wired as the exporter.
- K8s environment detection
- Collector config generation
- Scout exporter pre-wired