Full stack visibility
for humans and agents
Logs, metrics, traces, APM, Kubernetes, RUM and LLM telemetry in one OpenTelemetry-native platform. Full cardinality, full retention, a fraction of the cost.
Trusted by teams who refuse to compromise on data, control, or cost



All telemetry signals, one platform
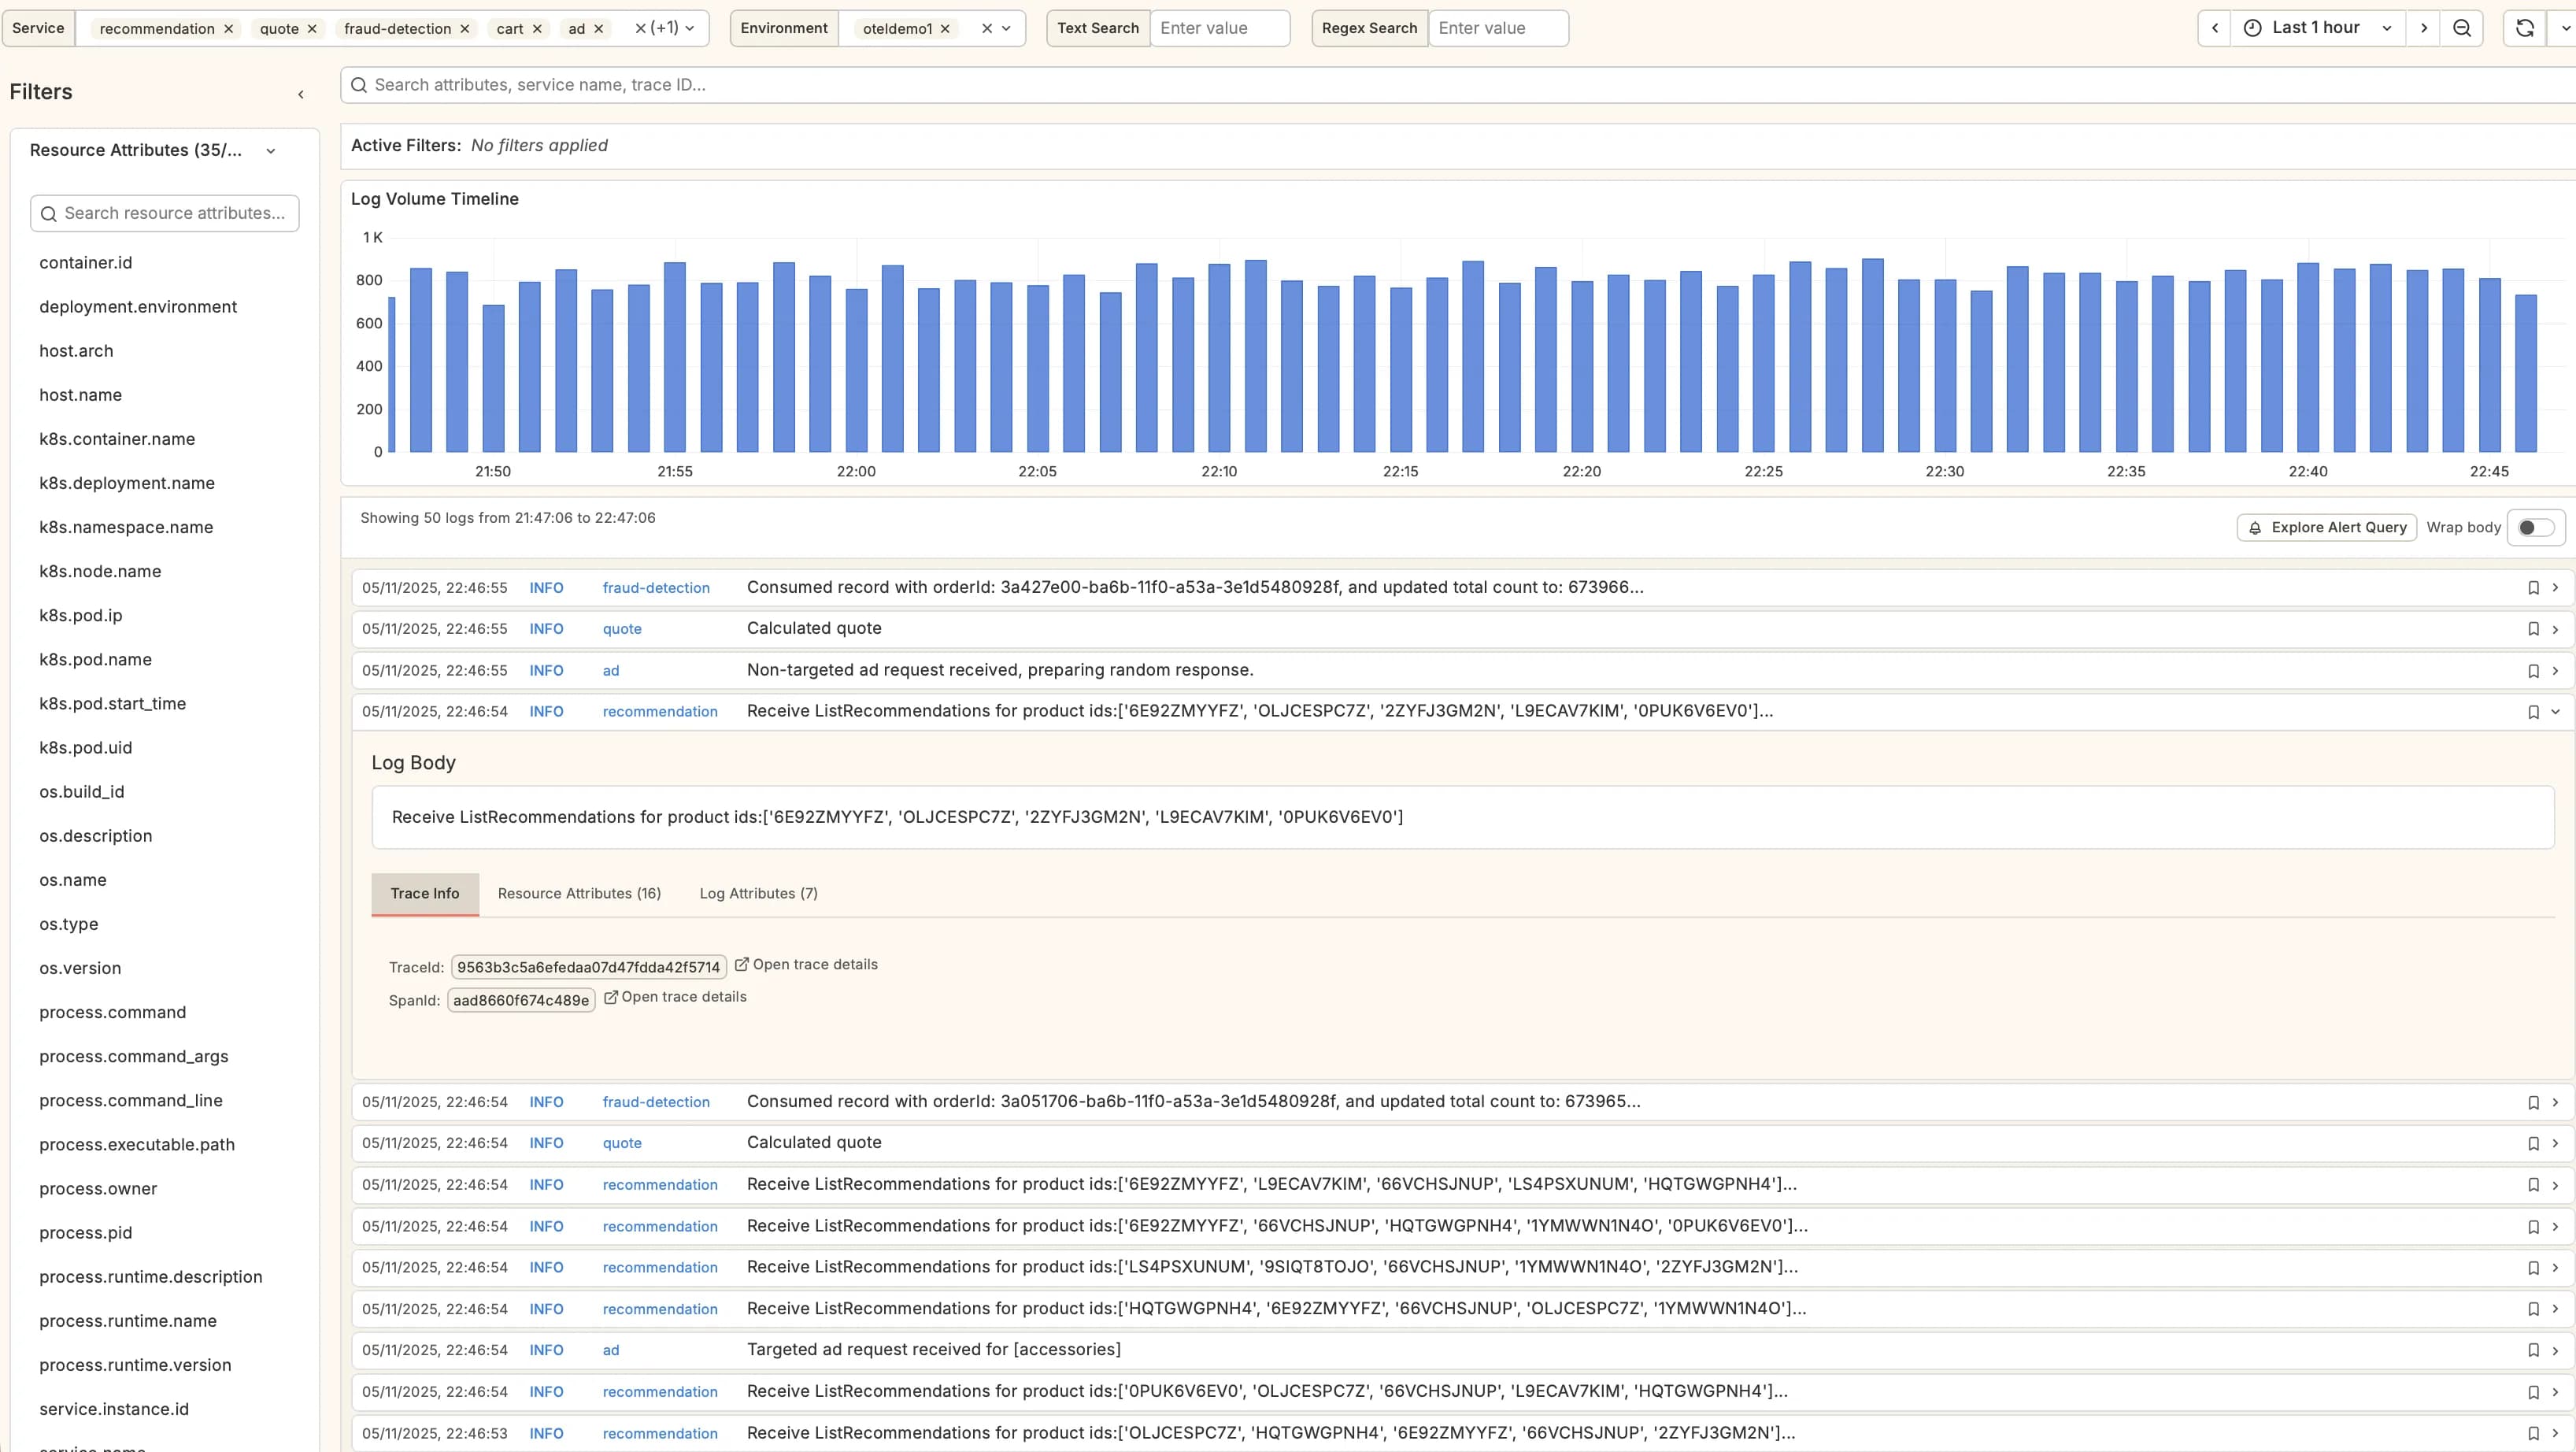
Structured and unstructured logs in one place. Search millions of lines, filter by any attribute, and jump from a log line to the trace that produced it.
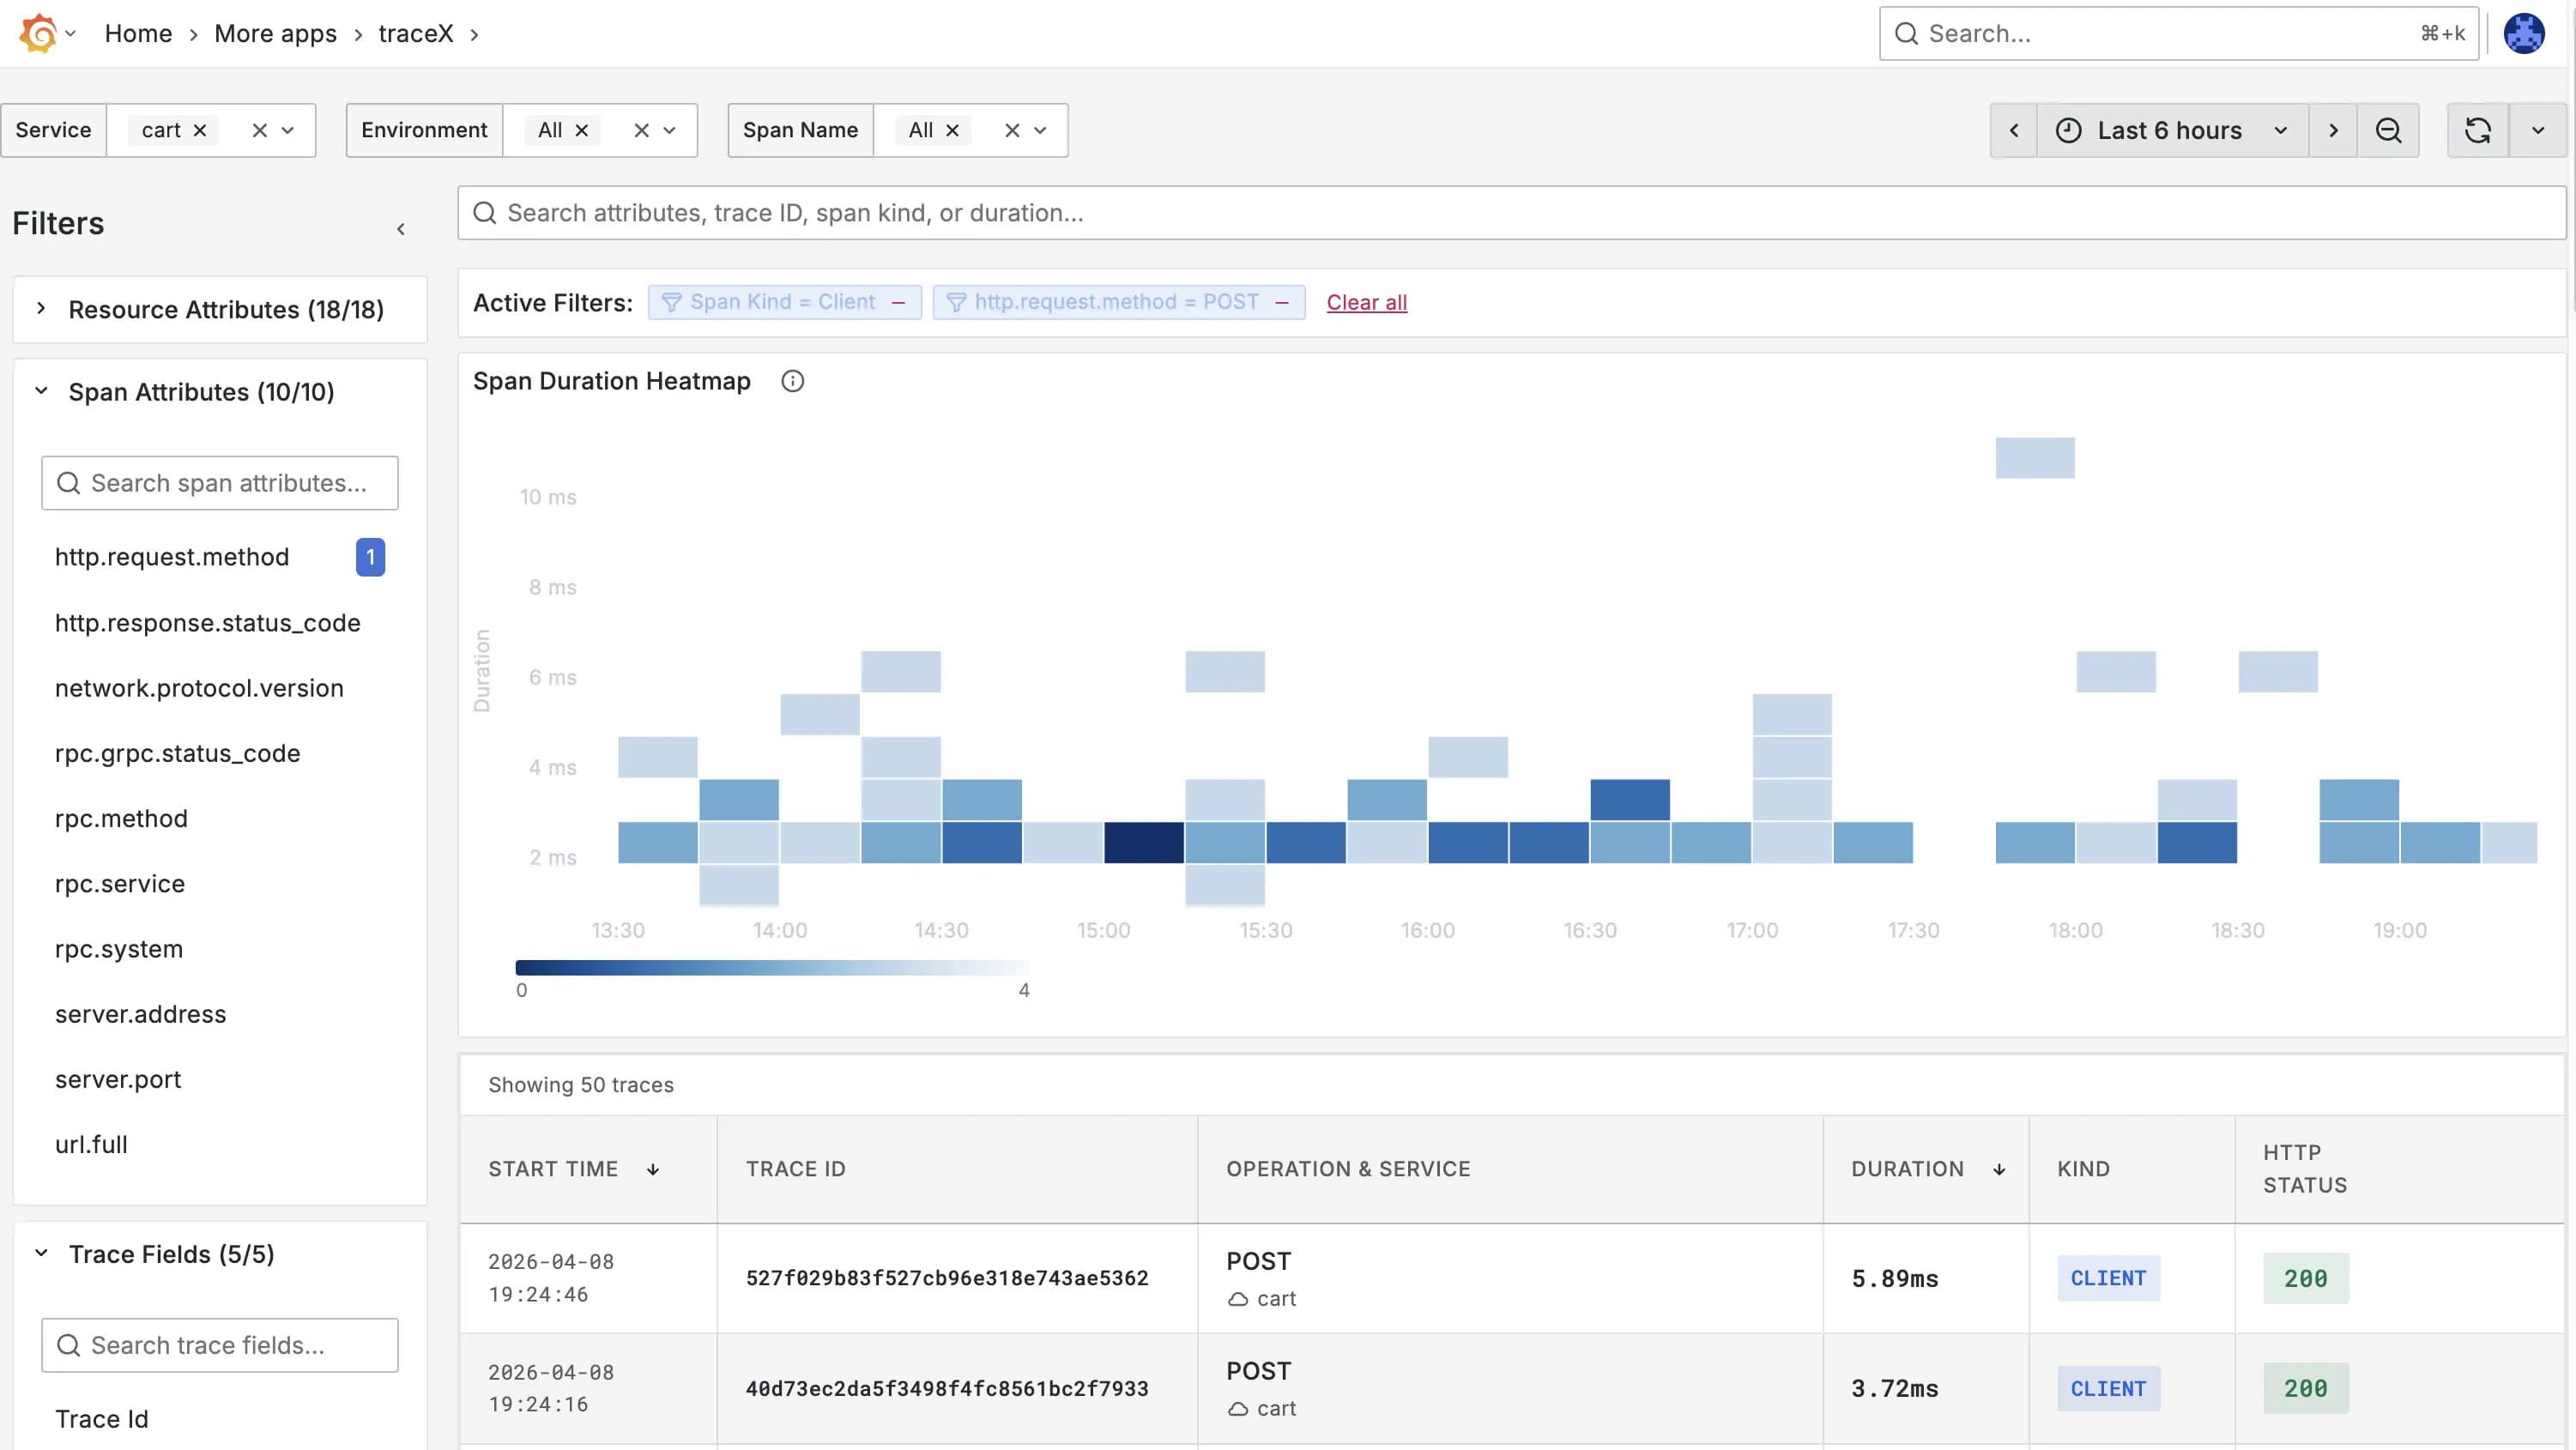
Follow any request from ingress to database, see service maps, pinpoint bottlenecks, and correlate latency with the logs and metrics from the same moment.
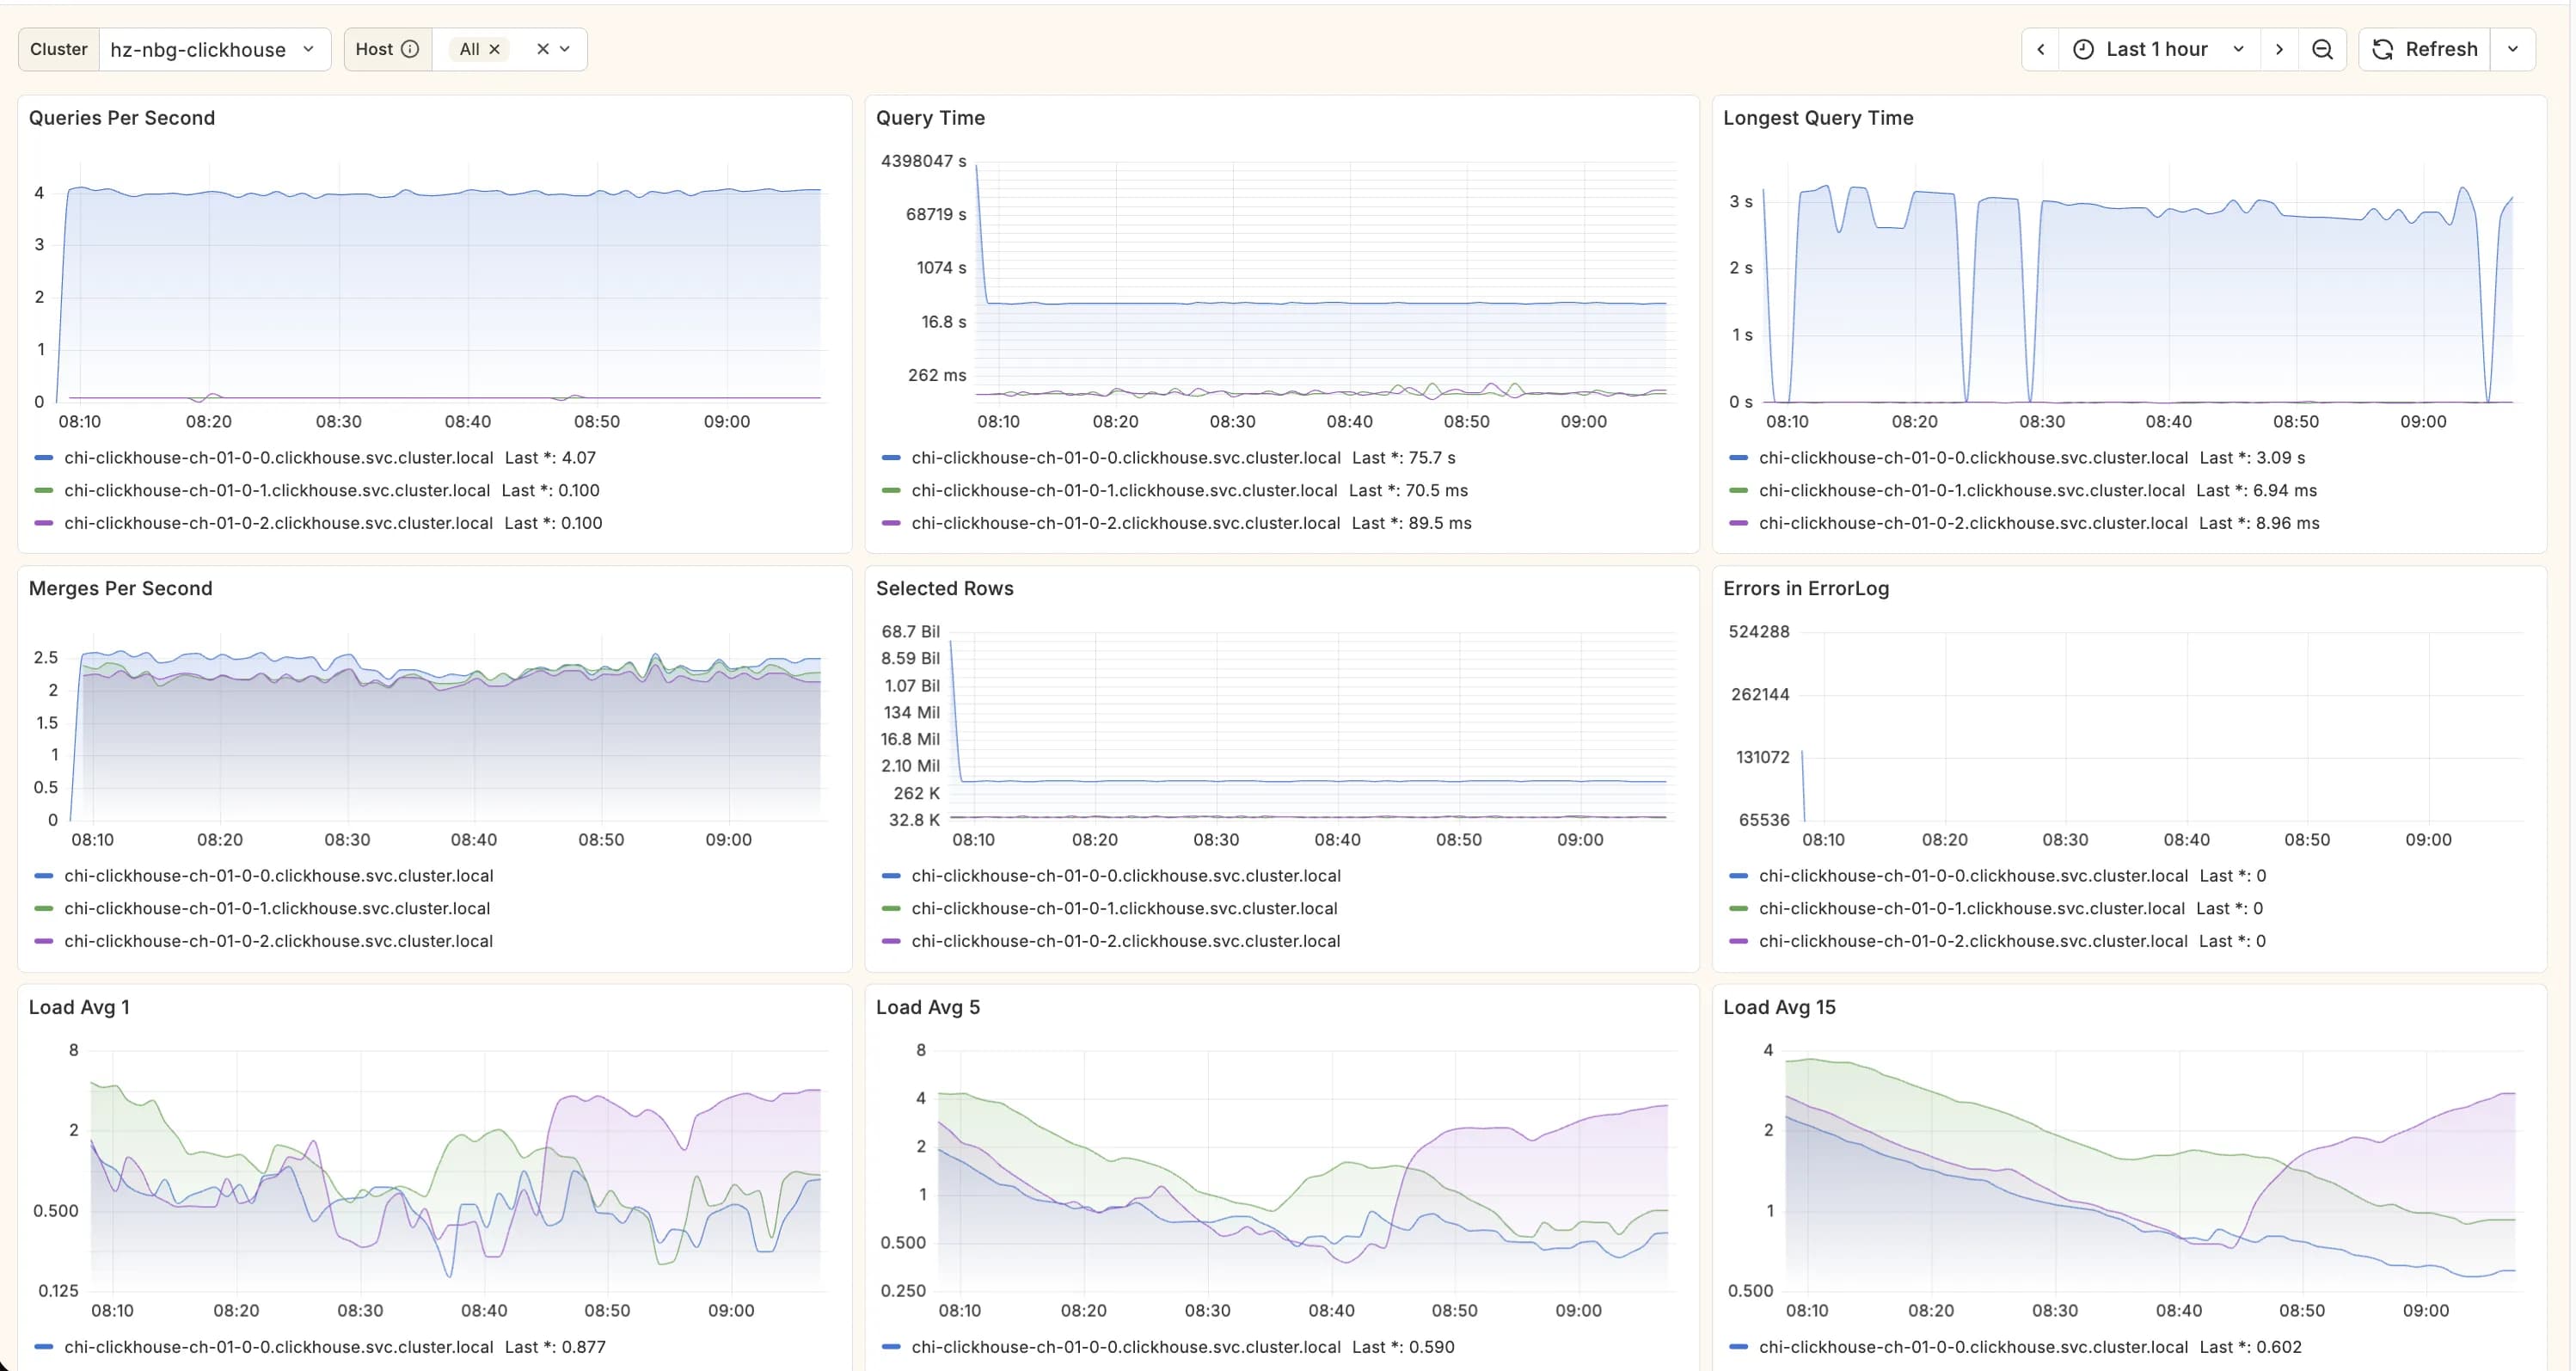
High-cardinality metrics without the high-cardinality bill. Query billions of unique series with unlimited dimensions at sub-second speed.
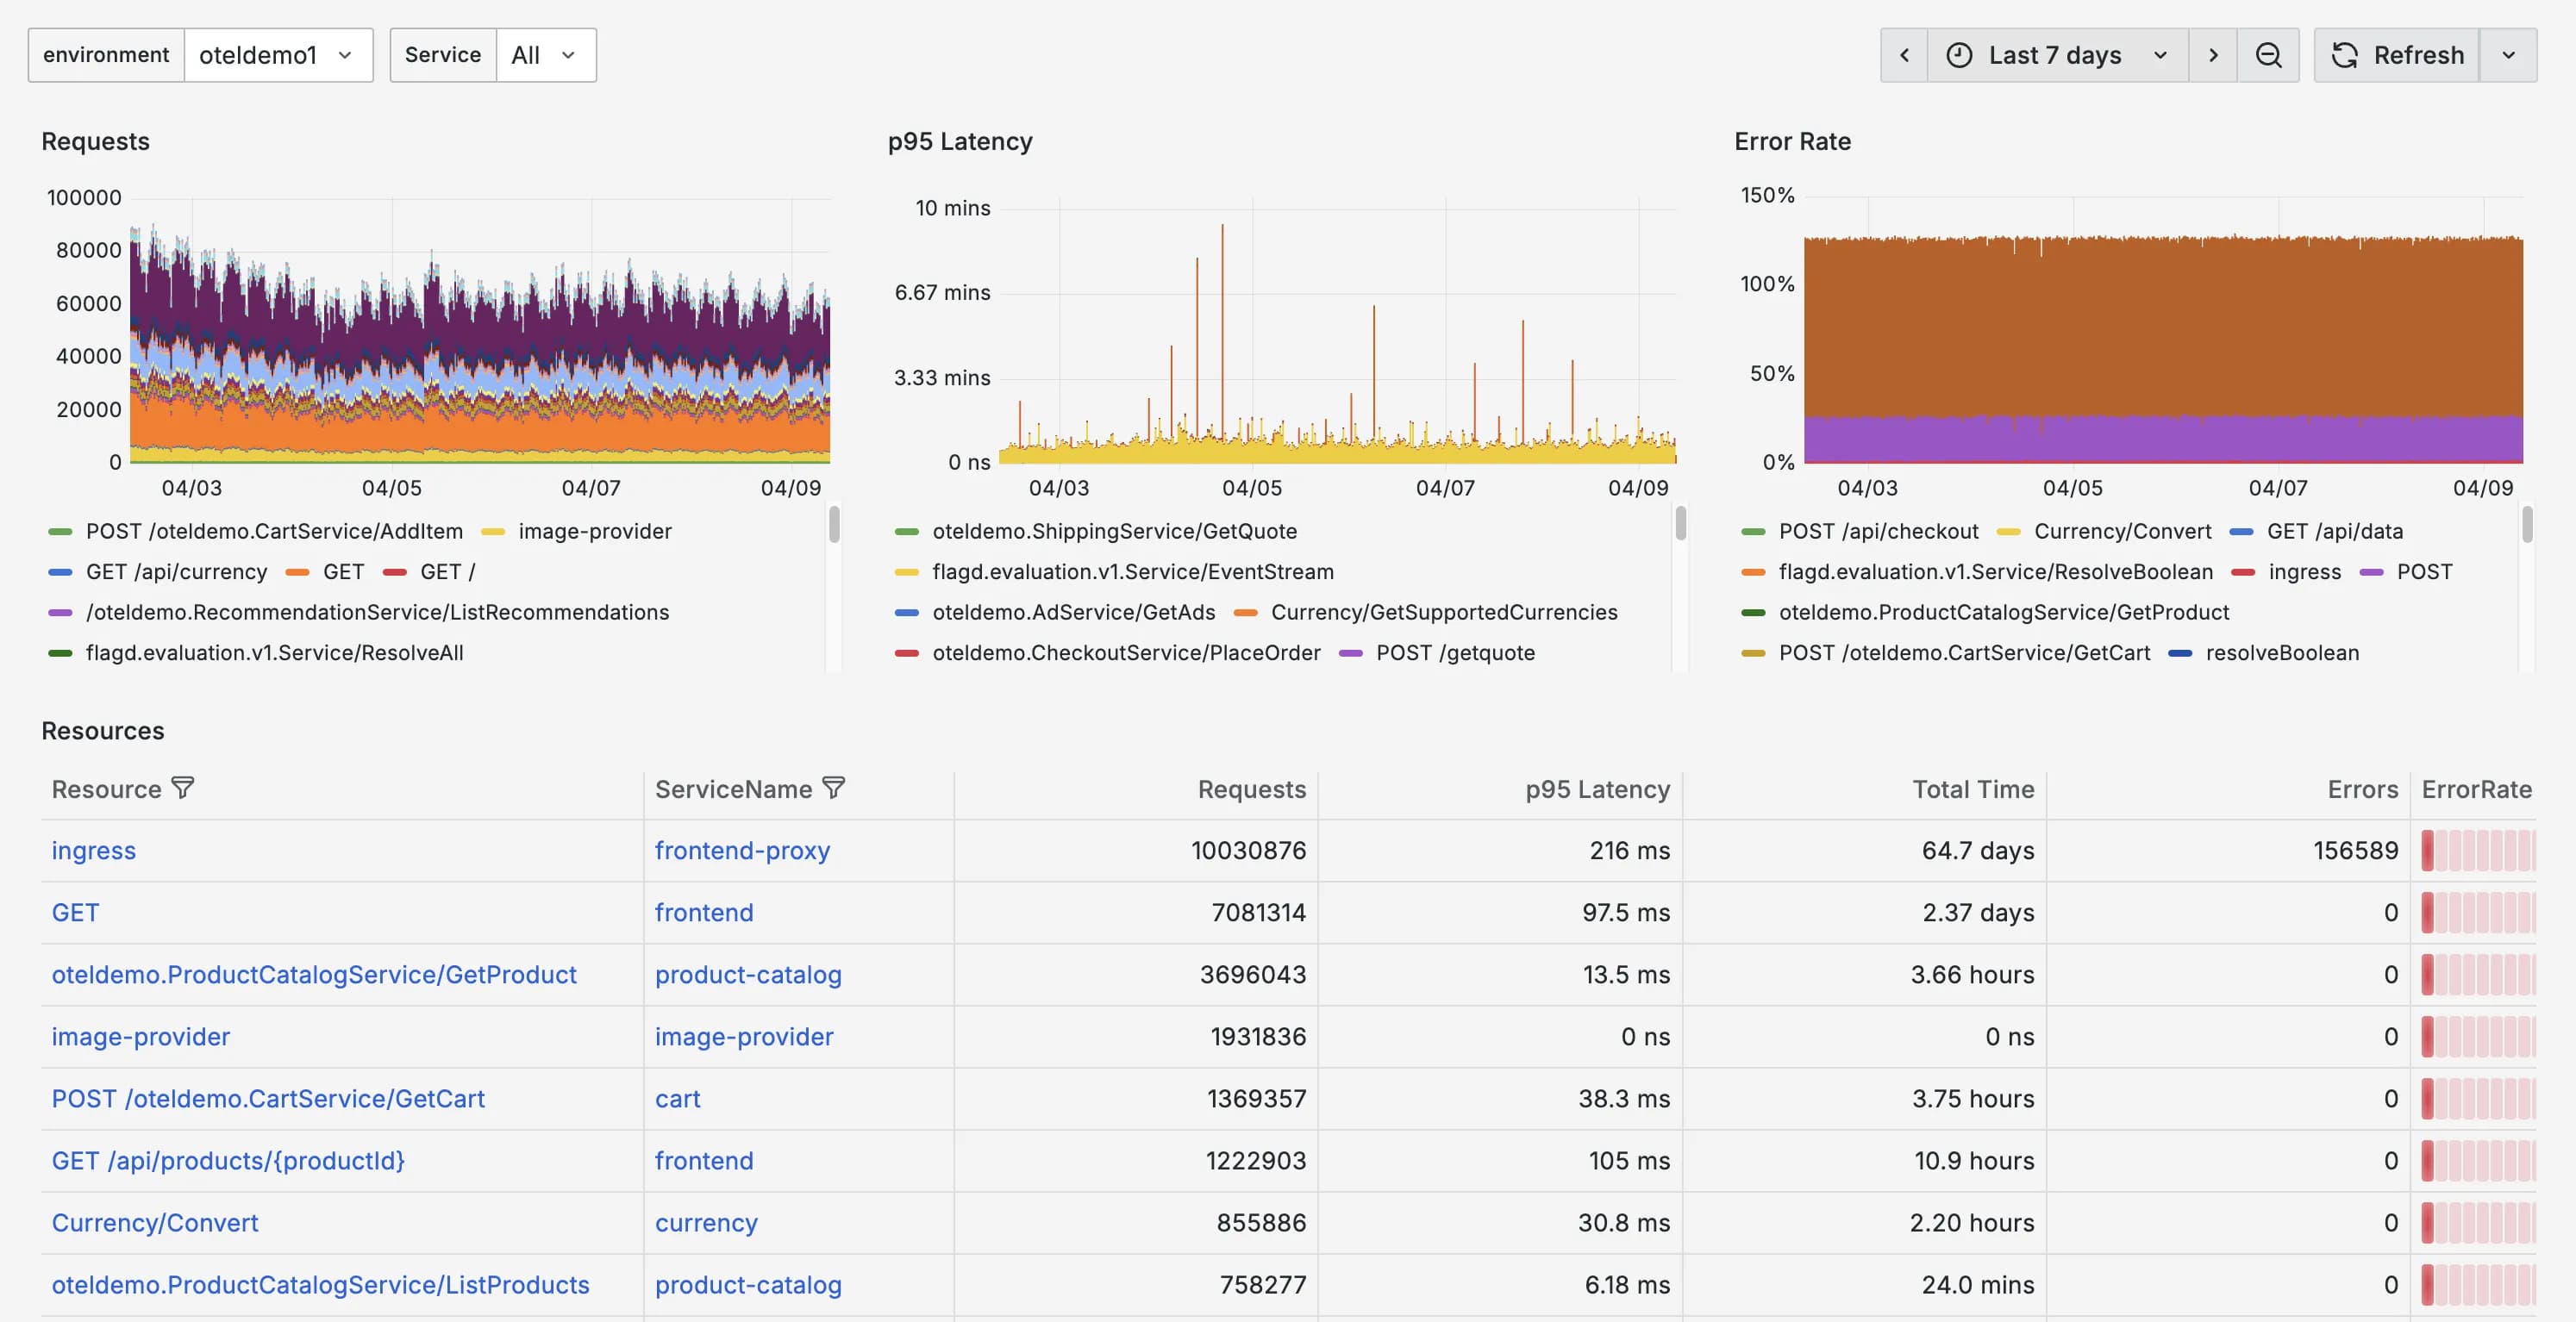
Application performance monitoring unified with tracing. Requests, p95 latency and error rate per service and per resource, with one click into the trace.
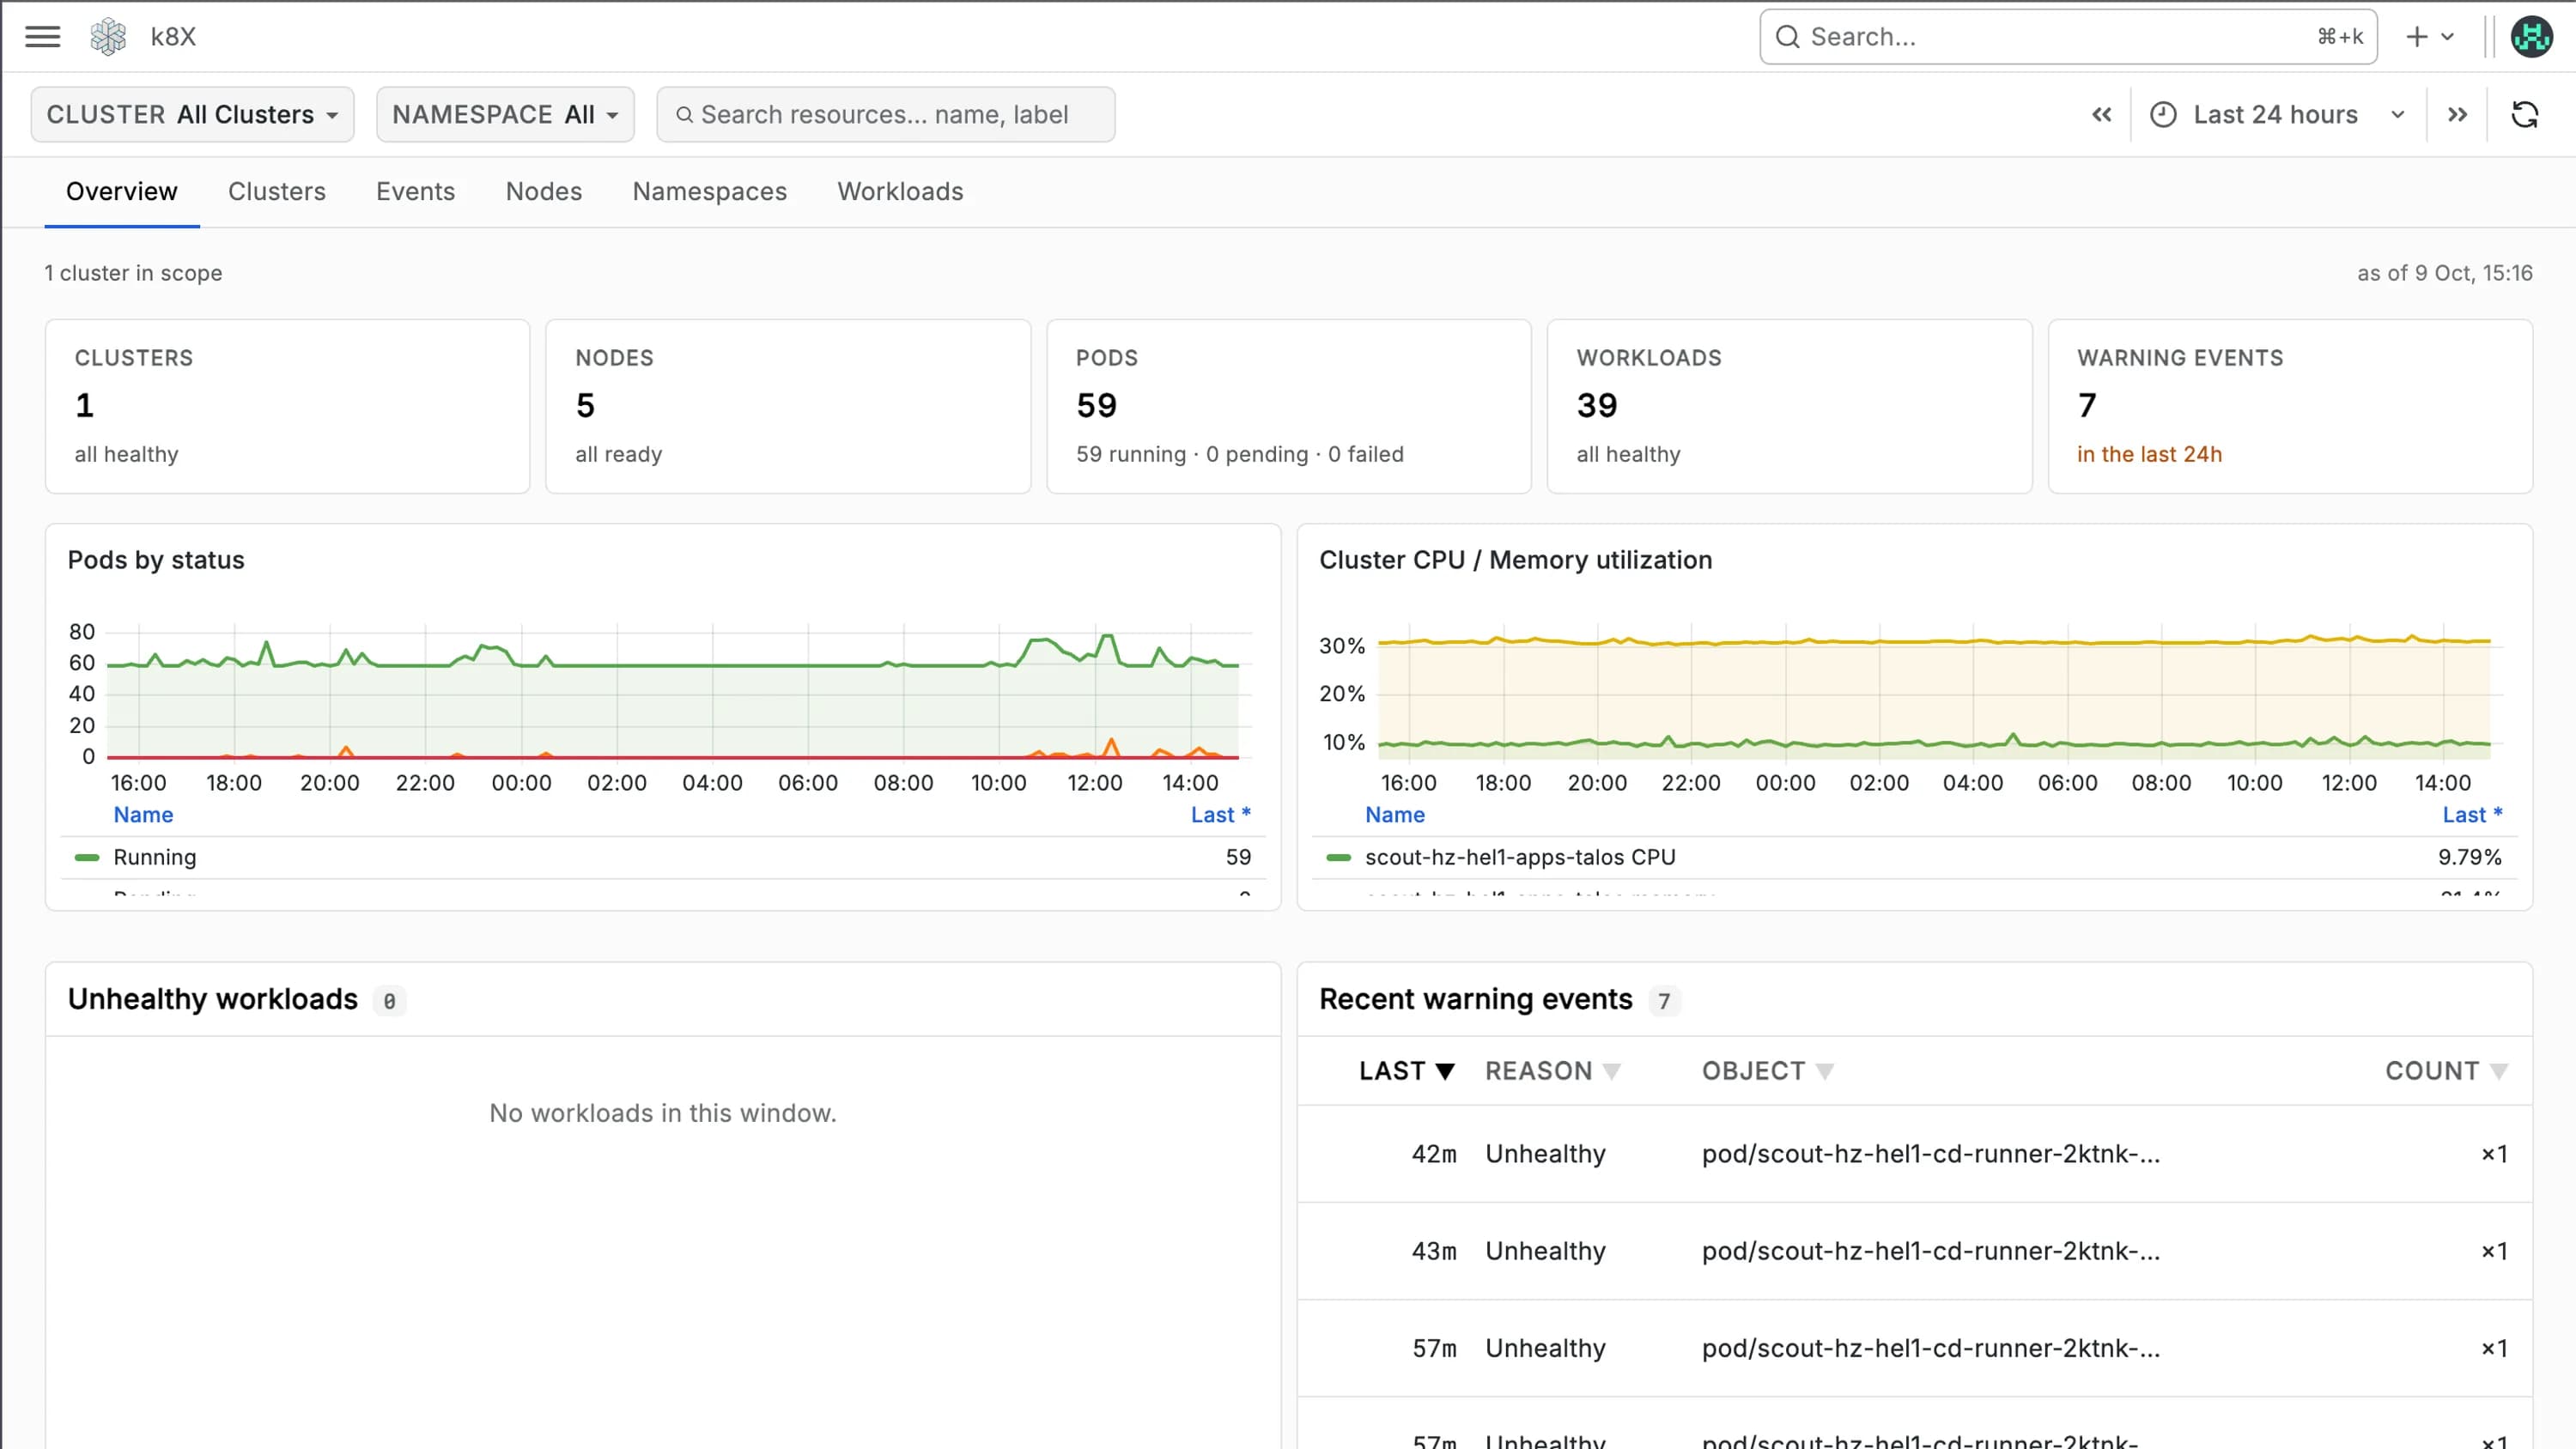
Cluster, node and pod health, workload CPU, memory and restarts, and every Kubernetes event, linked to the logs, metrics and traces each pod emits.
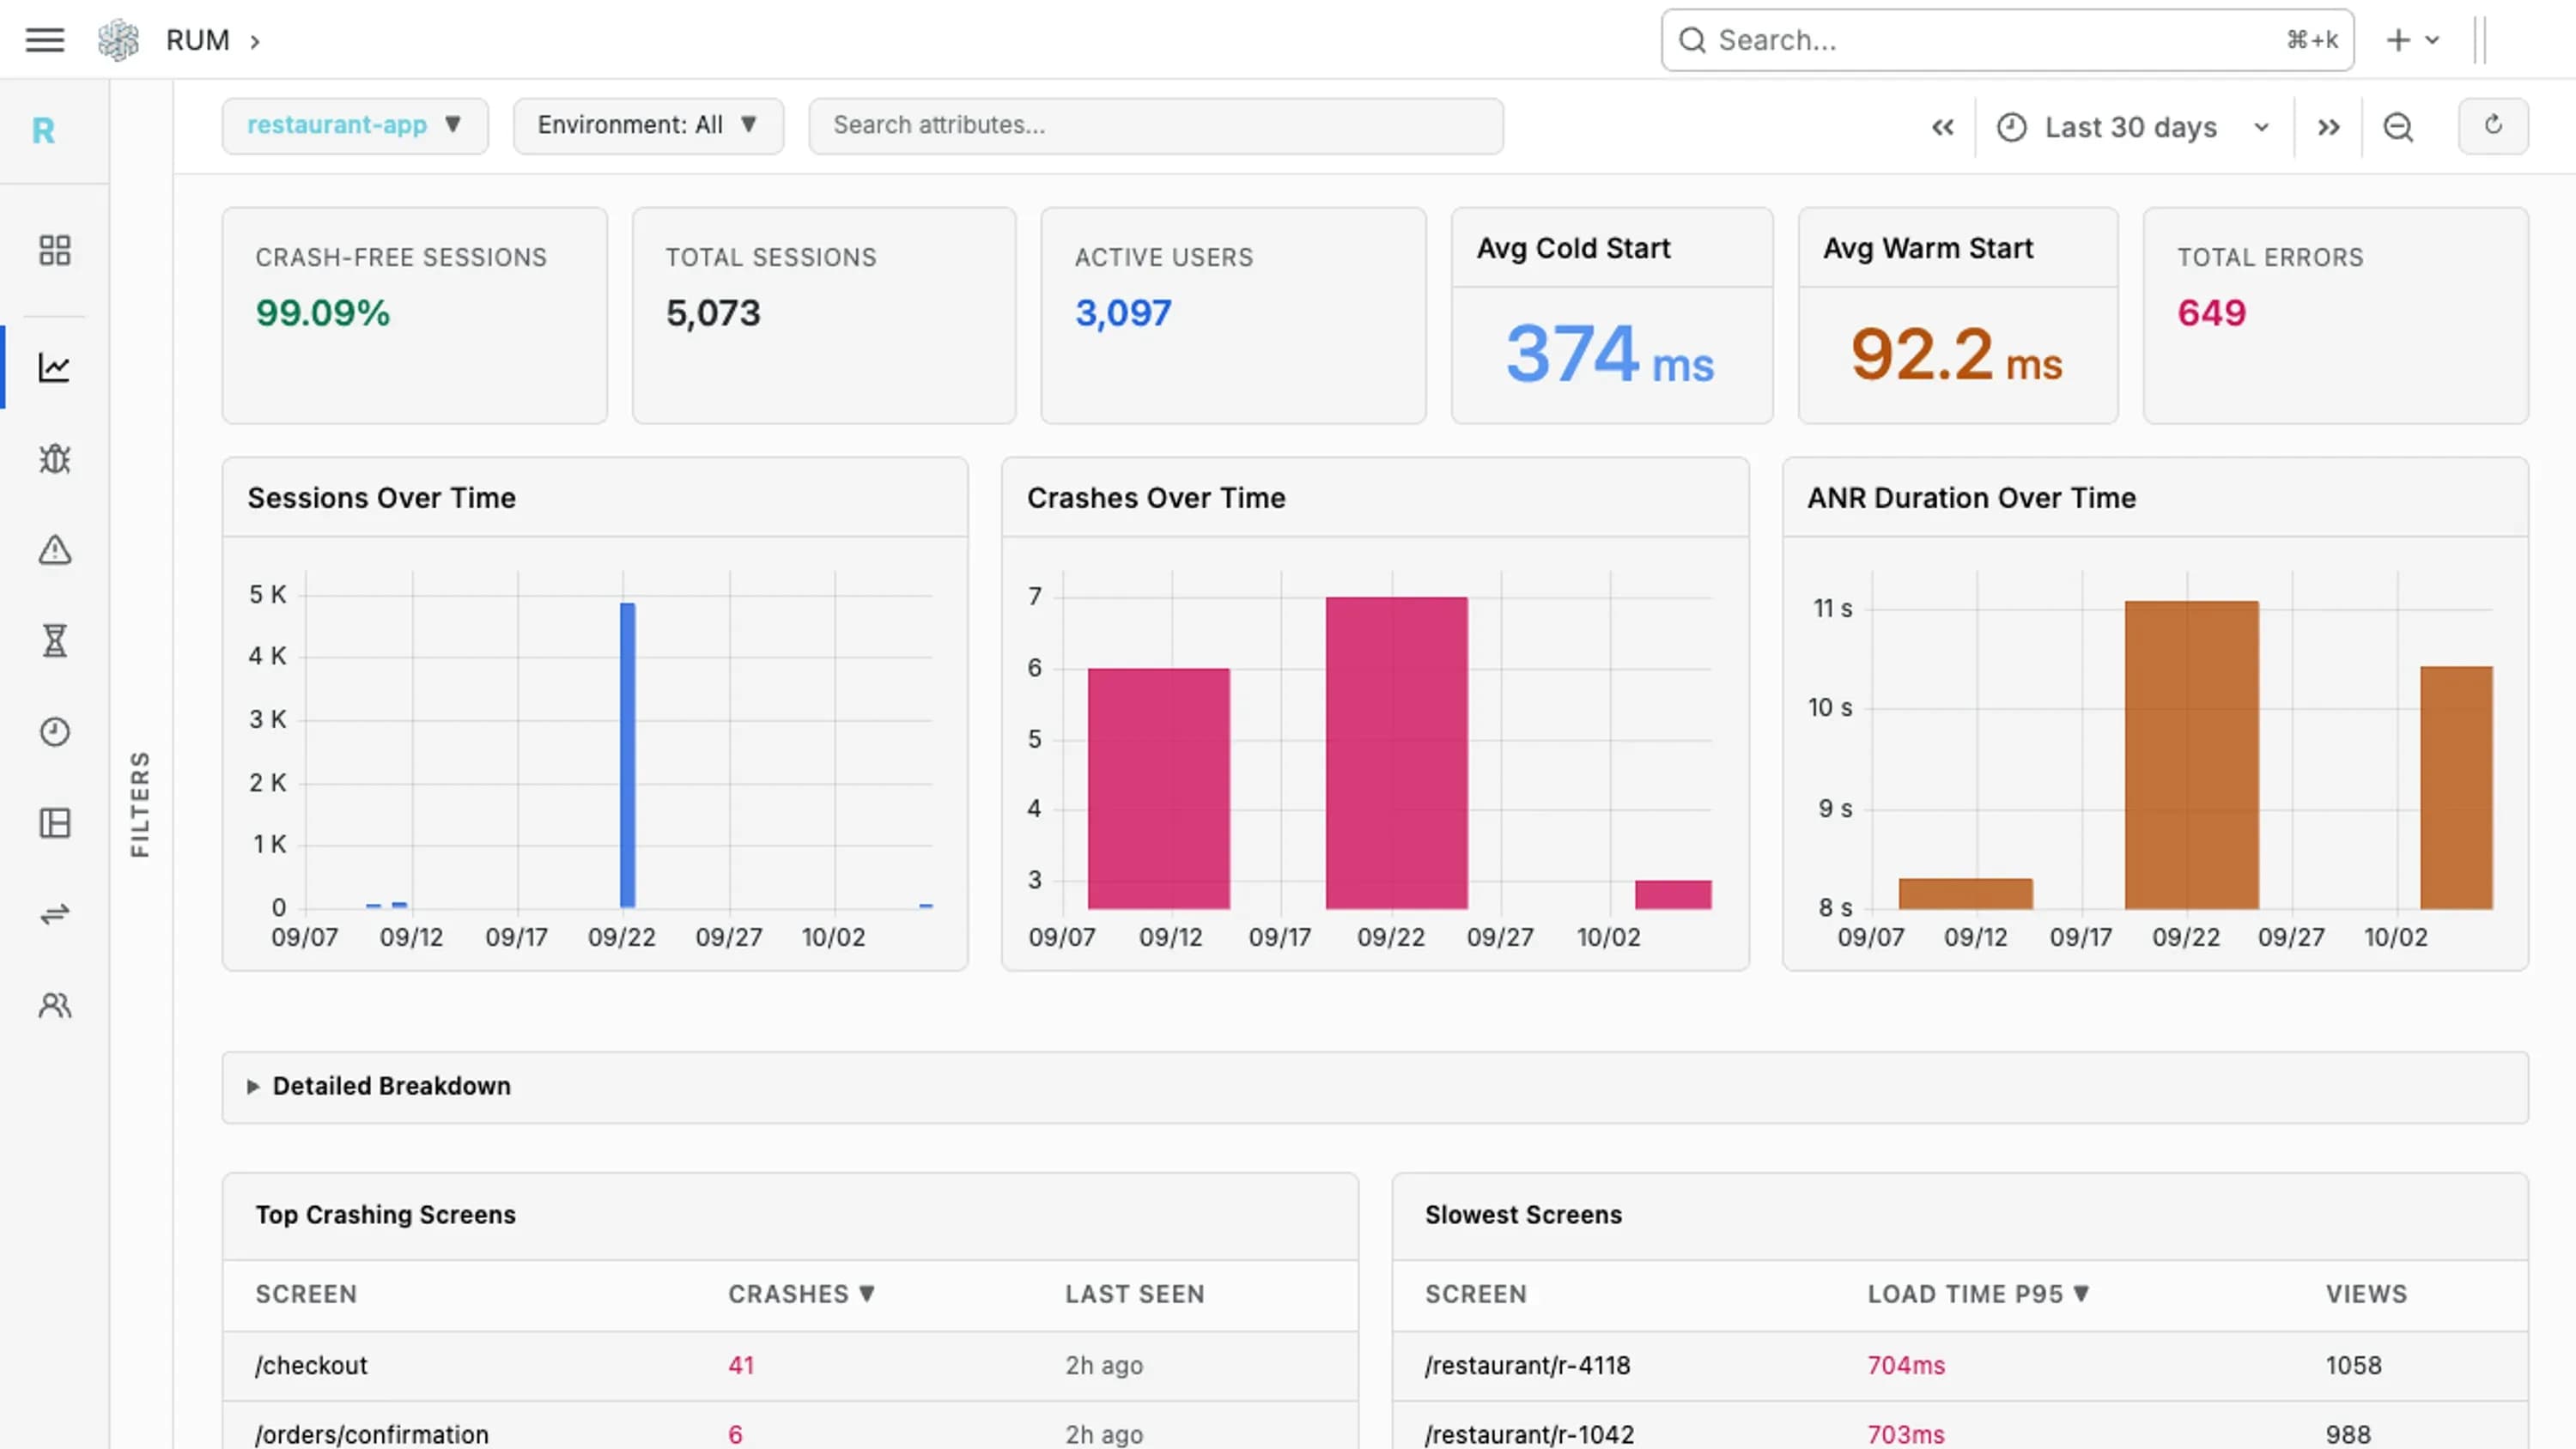
Crashes, ANRs, cold starts, screen loads and every HTTP call from Flutter, React Native, Android, iOS and the browser, linked to the backend trace each request started.
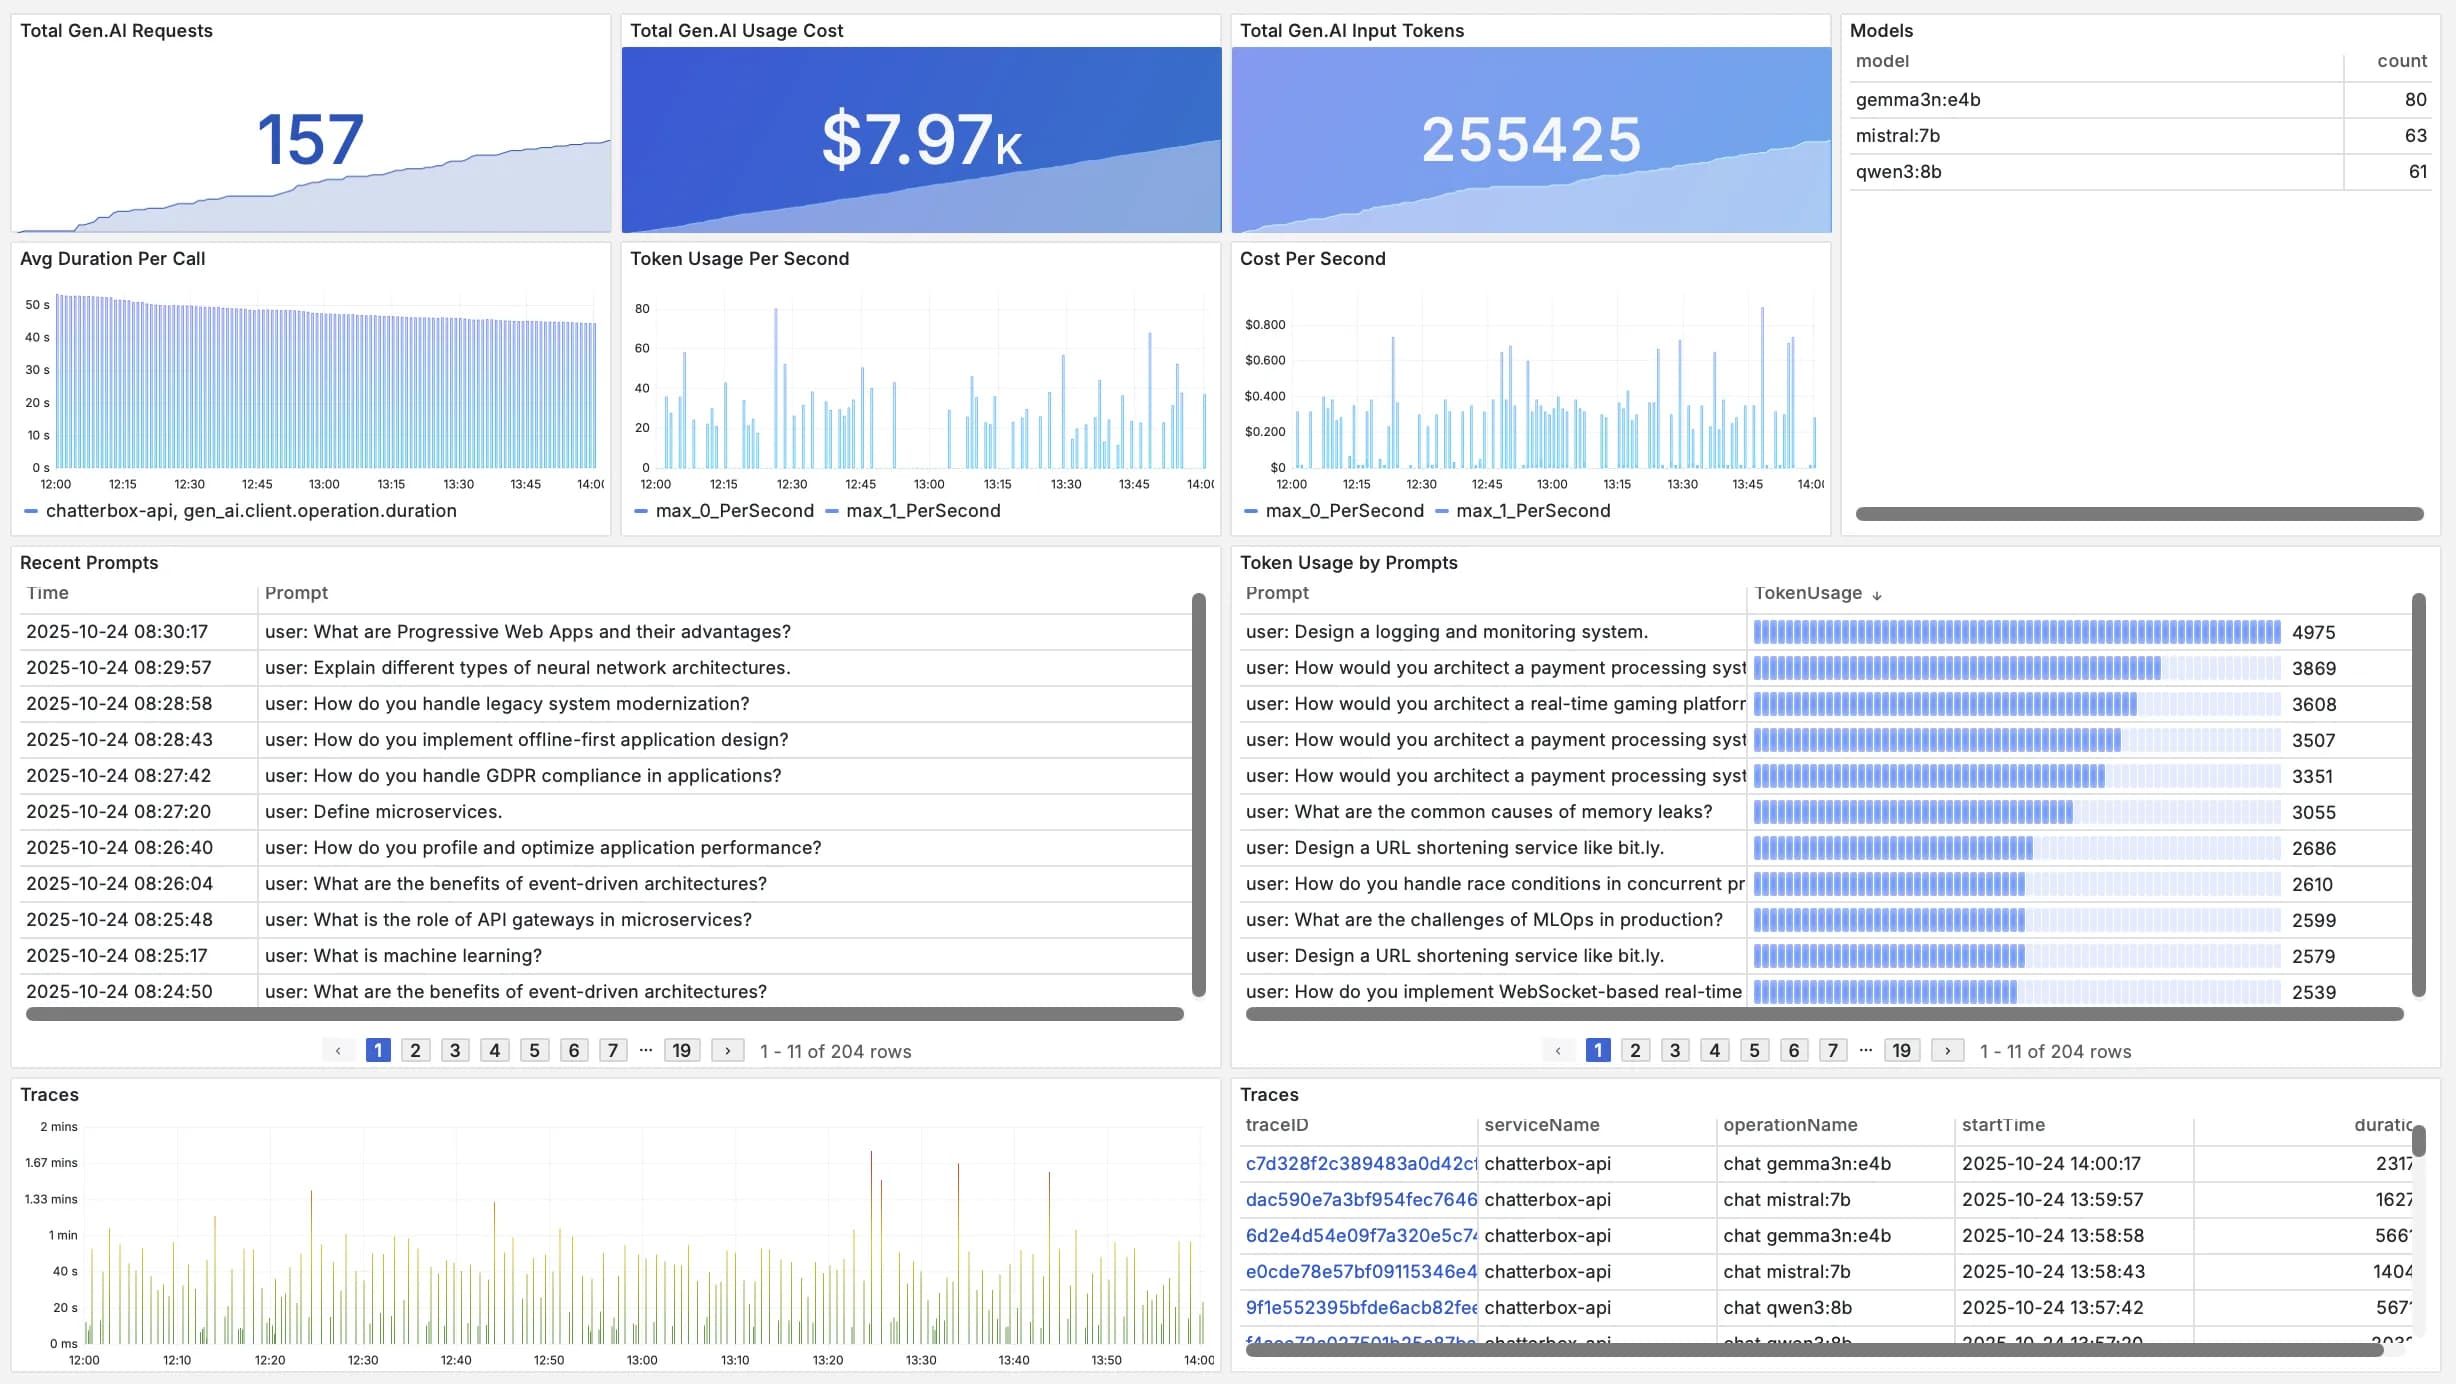
Trace every agent run and LLM call end to end, track tokens and cost by agent, and version prompts and evals in the same platform.
One data lake. Every signal. No compromises.
Purpose-built columnar storage that unifies all your telemetry in a single queryable lake.
Unified telemetry data lake
Cross-signal correlation happens at the storage layer, so a single query can join logs, metrics, traces and LLM telemetry natively.
- Single query across all signals
- Storage-level correlation
- Native SQL interface
Full cardinality, zero sampling
Every trace, every metric, every log line. No sampling that hides the outliers causing your incidents.
- No sampling or pre-aggregation
- Unlimited cardinality dimensions
- Sub-second on billions of points
Cost-efficient retention
30 days hot and full resolution on disk, then your own S3-compatible bucket for perpetual, queryable retention.
- 180-day APM and RUM baselines
- Purpose-built compression
- Full resolution at any retention
Scout runs where your systems run
Every Scout cluster sits in the same cloud region as the systems it watches. Telemetry takes a short hop instead of crossing the internet, so egress costs stay minimal and data lands without added latency.
Managed
We run Scout on base14 clusters in your cloud and region. Your telemetry takes the short path, and we handle the operations.
- Minimal egress cost
- No added ingest latency
- Upgrades and scaling handled by base14
Bring your own cloud
Scout runs inside your own cloud account, so prompts, queries and traces never leave your boundary. The base14 control plane manages it remotely.
- Telemetry stays in your VPC
- Built for vendor security reviews
- Predictable infrastructure cost
Notes from the field
“Our goal was to improve reliability without increasing cost, and base14 made that possible. The ability to view APM, infra, and database insights together has helped our team move from reactive to data-driven problem solving. It's an observability platform that actually makes engineers faster and executives more confident.”
Sahil Kharb
Founder, Glomo