Kubernetes, pod by pod
Clusters, nodes, namespaces, workloads and events in one view, linked to the logs, metrics and traces your pods emit.
Trusted by industry leaders



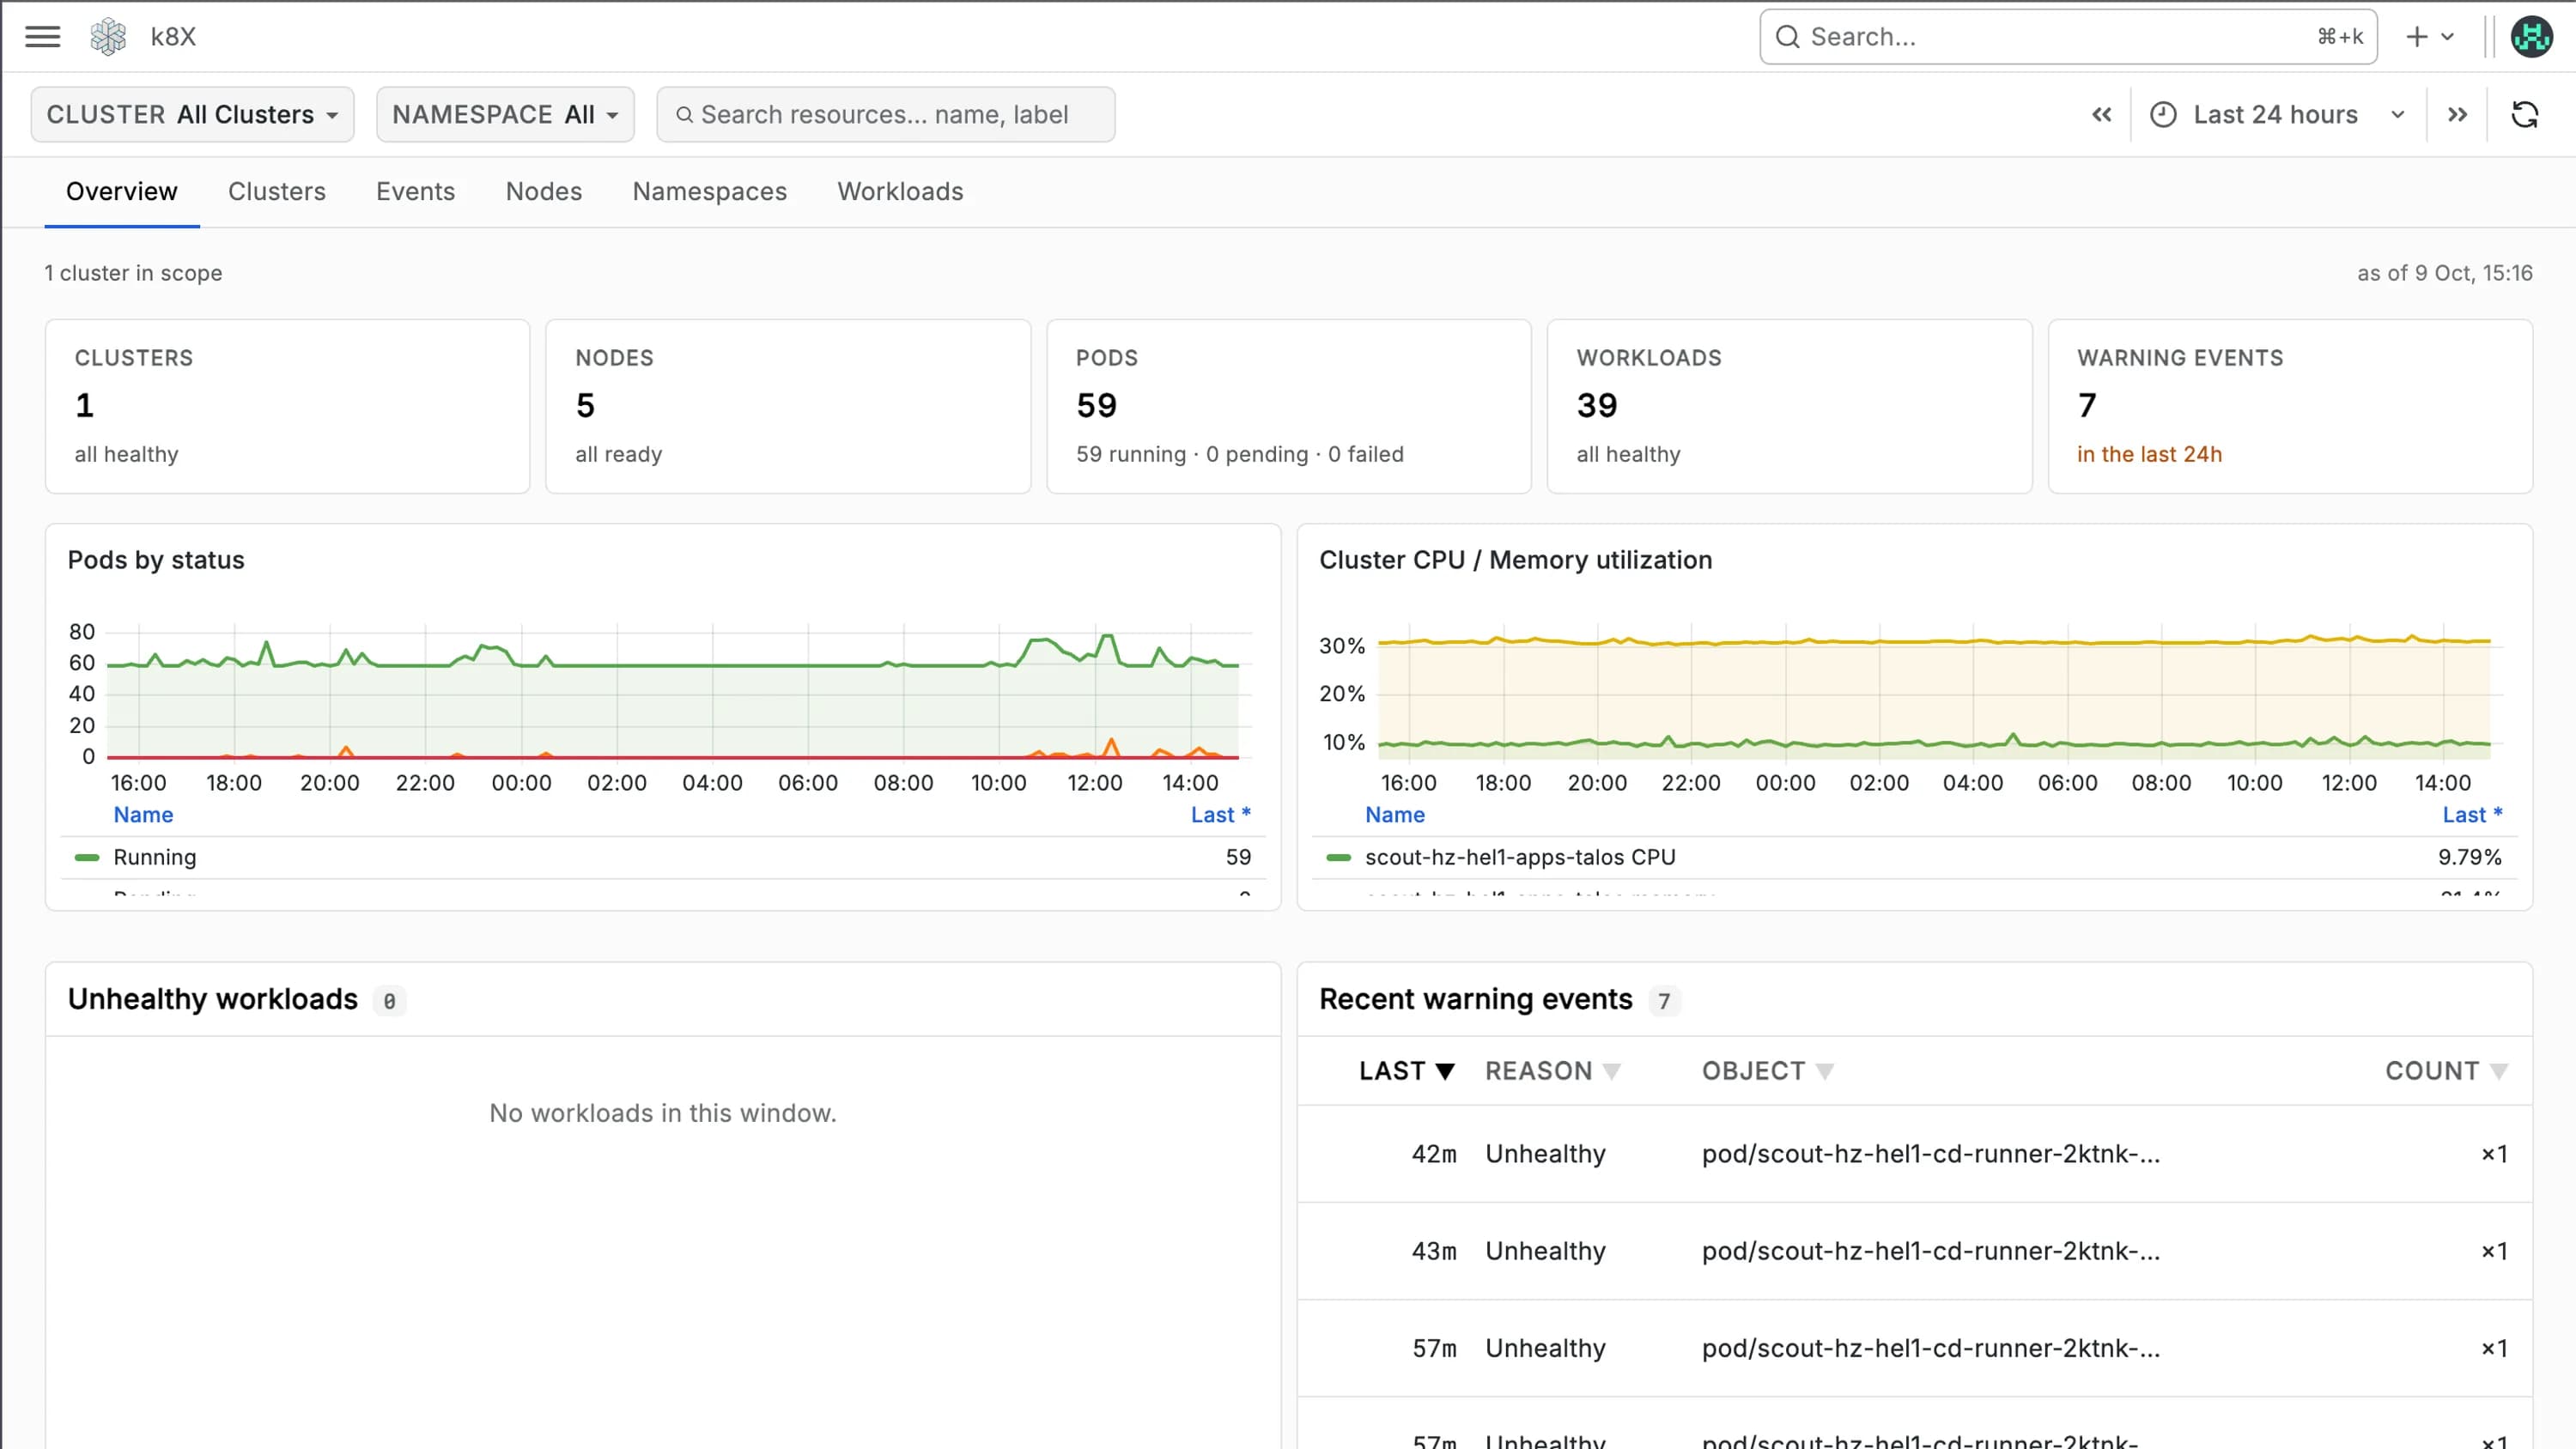
Every cluster, every workload, every pod
Go from a cluster-wide view to a single container in a few clicks, with the context to know why it is unhealthy.
Clusters, nodes, pods and workloads at a glance, with pods by status, cluster CPU and memory, unhealthy workloads and the latest warning events. Every pod, even the ones that lived for 30 seconds.
- Pods by status
- Cluster utilisation
- Warning events
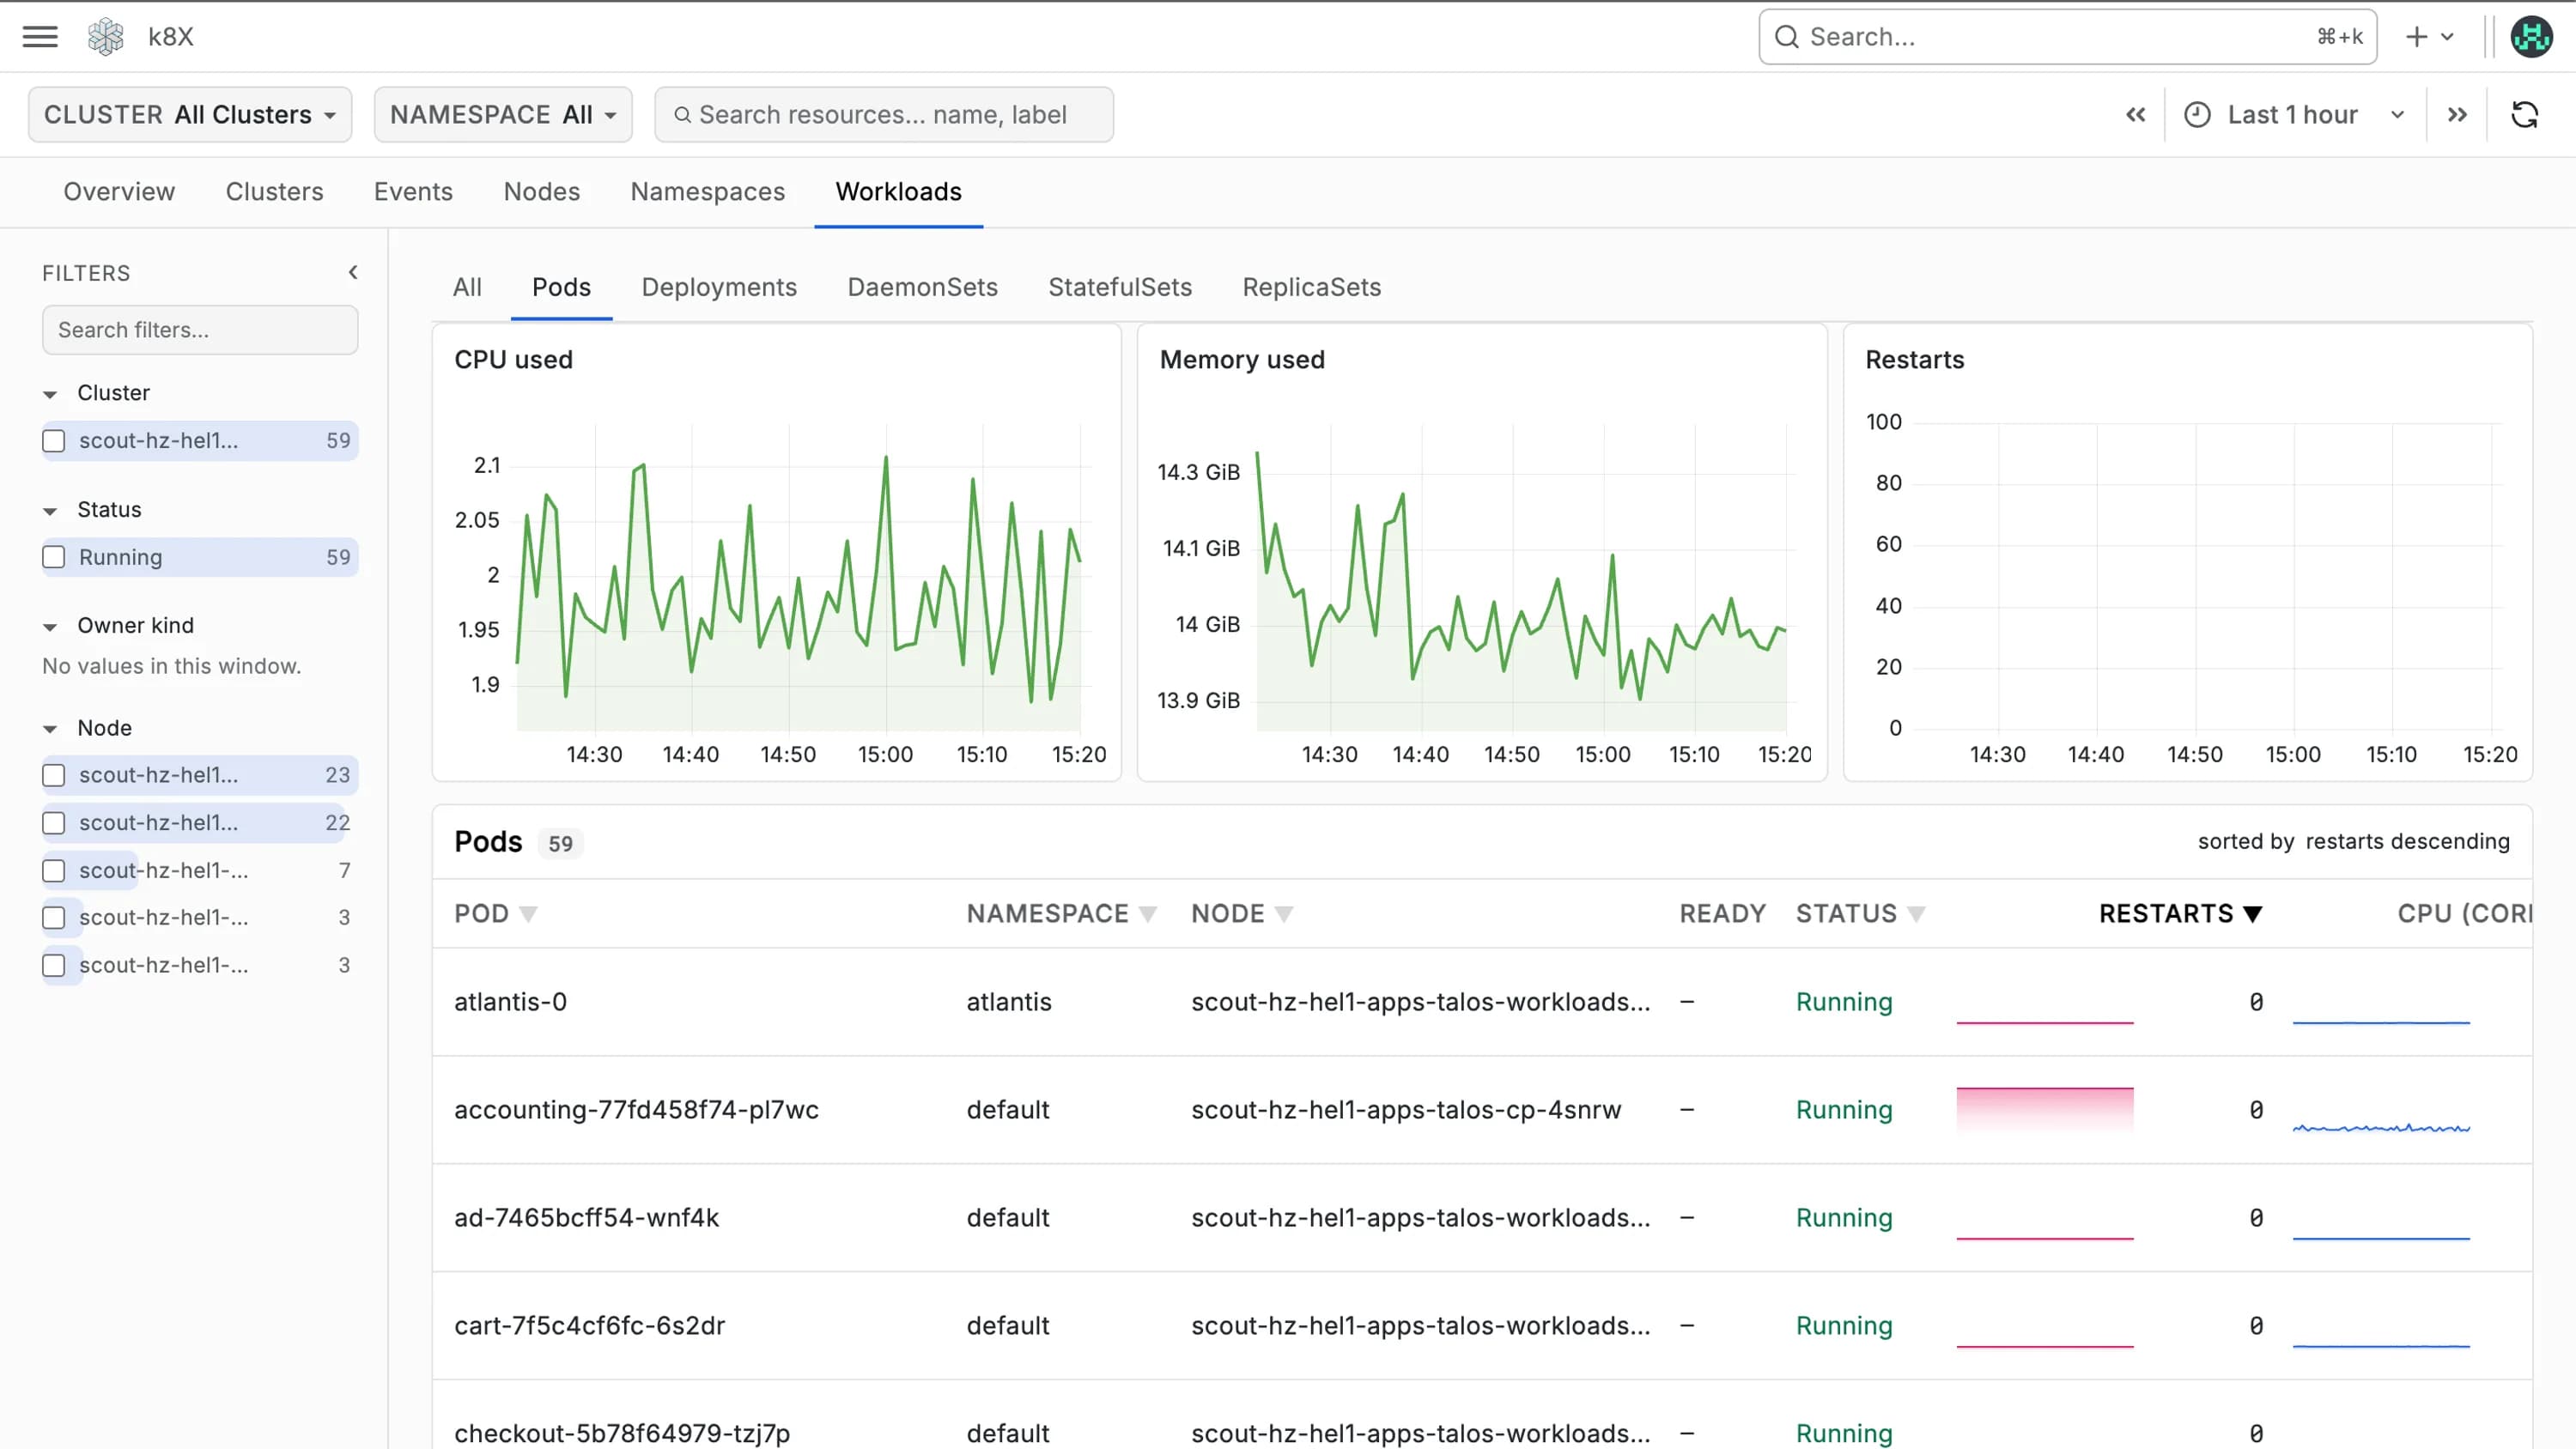
Pods, Deployments, DaemonSets, StatefulSets and ReplicaSets with CPU, memory and restarts over time. Sort by restarts to find the pod that keeps falling over.
- CPU and memory
- Restarts
- Per-pod trends
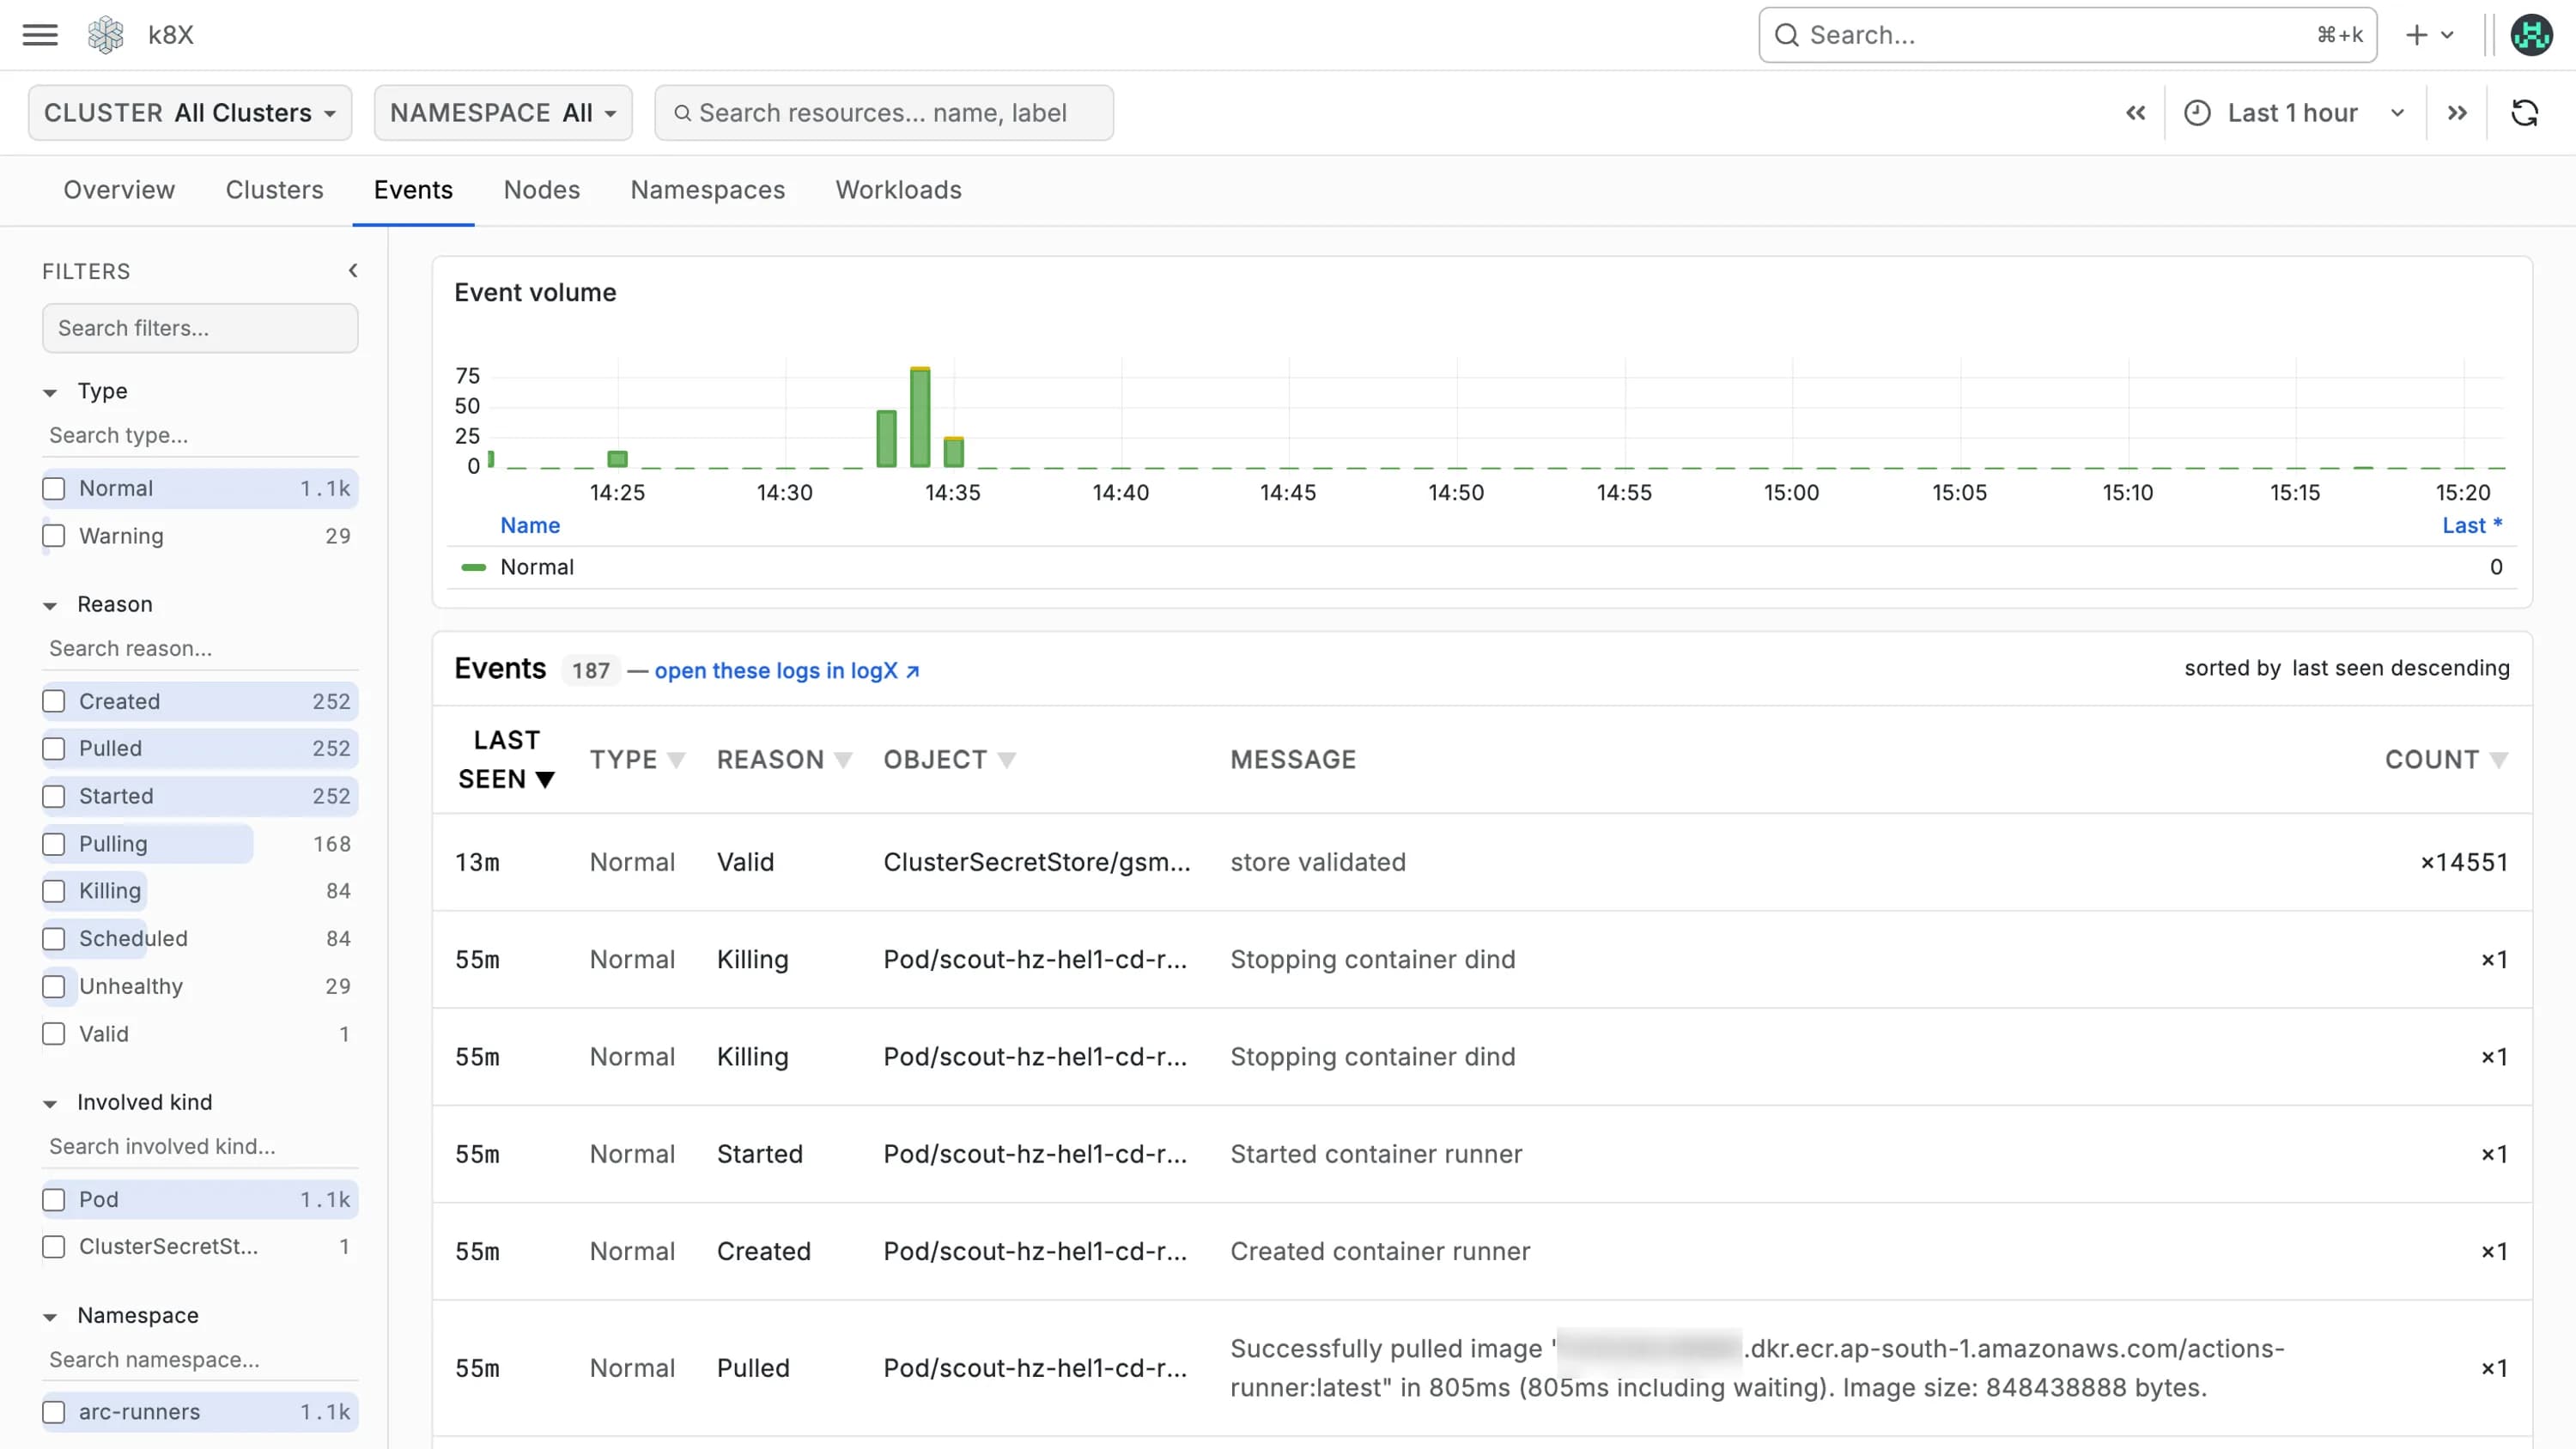
Every Kubernetes event with its volume over time, filtered by type, reason, kind and namespace. Open the same events as logs in one click, so a failed schedule or a crash loop comes with its cause.
- Event volume
- Reason filters
- Open in logs
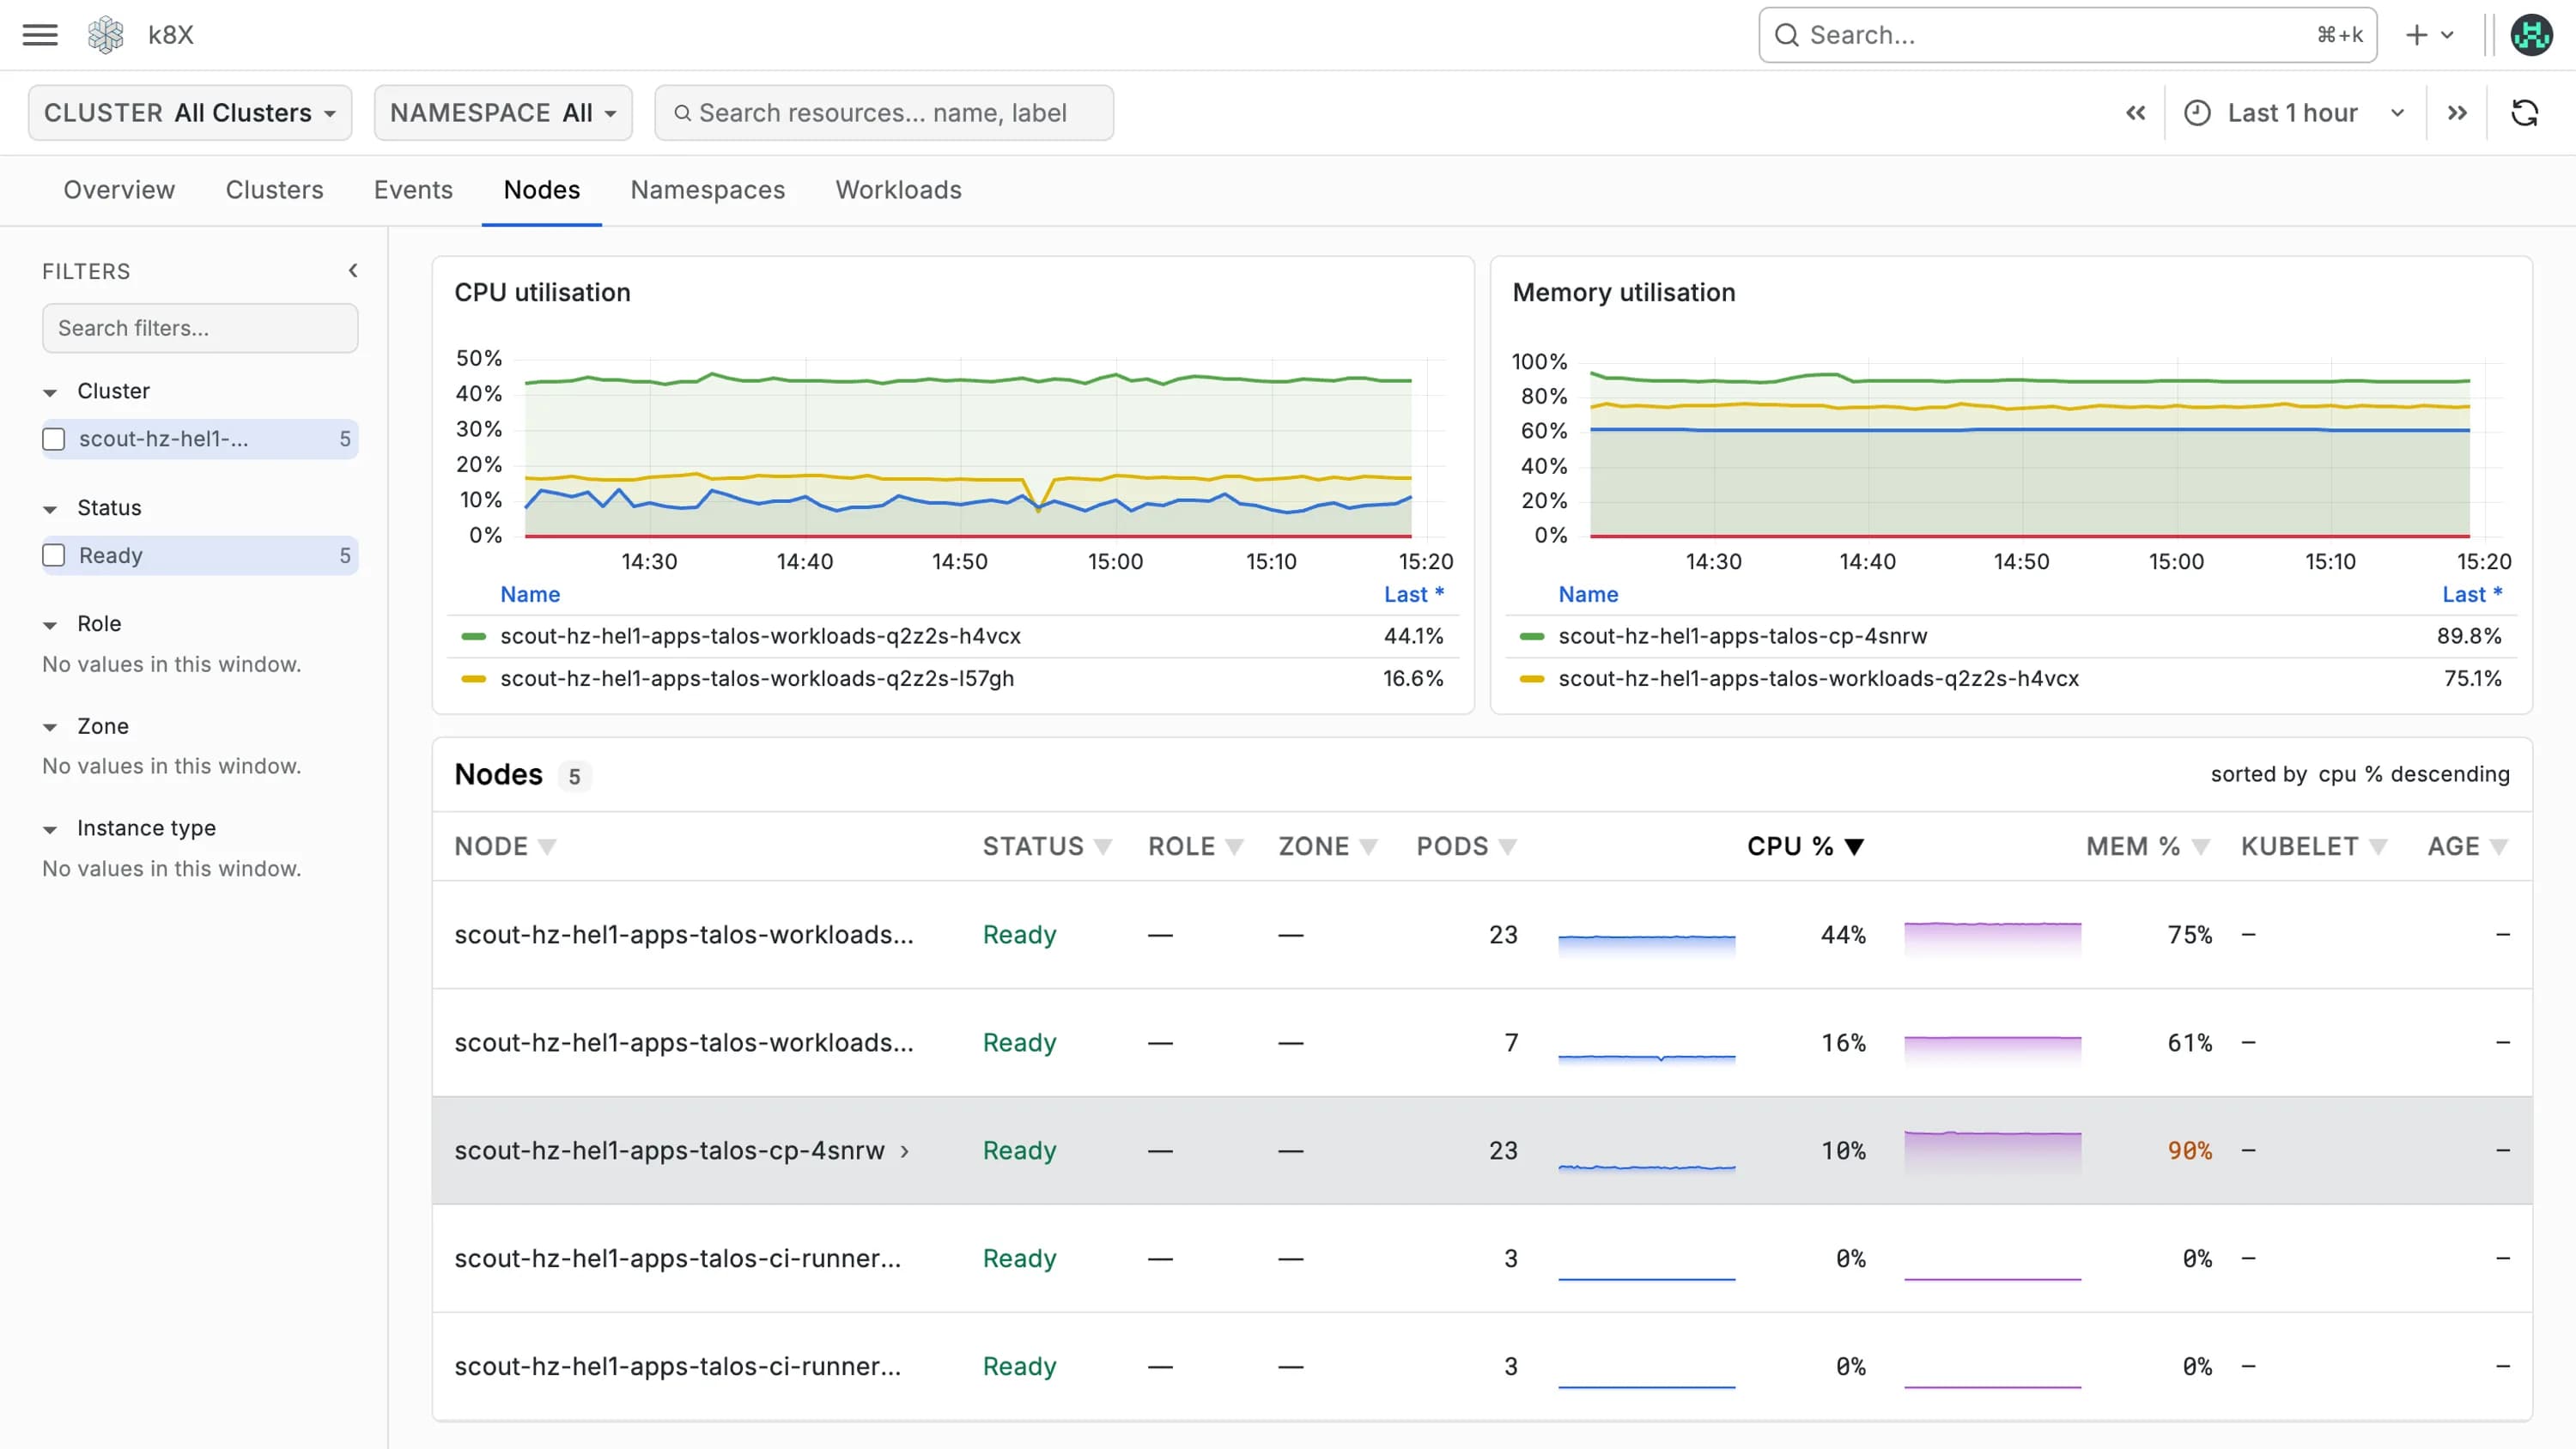
CPU and memory utilisation for every node, with status, pod count and filters by cluster, role, zone and instance type. Spot the node running hot before it starts evicting pods.
- CPU and memory
- Pods per node
- Zone and role
Kubernetes connected across all signals
Every signal carries its Kubernetes context, so you can move from a pod to its logs, metrics and traces without losing your place.
Built on open standards
Collect Kubernetes telemetry with the OpenTelemetry Collector and the exporters you already run.
OpenTelemetry Collector
Uses the upstream k8s_cluster, kubeletstats and k8sattributes components, deployed with a Helm chart. No proprietary agents.
kube-state-metrics Compatible
Works alongside kube-state-metrics and Prometheus exporters, so existing dashboards and alerts carry over.
Trusted worldwide
Notes from the field
“Our goal was to improve reliability without increasing cost, and base14 made that possible. The ability to view APM, infra, and database insights together has helped our team move from reactive to data-driven problem solving. It's an observability platform that actually makes engineers faster and executives more confident.”
Sahil Kharb
Founder, Glomo